CHIRPS: Climate Hazards InfraRed Precipitation with Station data (Version 3)

Climate Hazards Group InfraRed Precipitation with Station data version 3 (CHIRPS v3)is a 1981-present, land-only, high resolution 0.05° gridded precipitation dataset. It combines thermal-infrared geostationary satellite-based estimates (CHIRP3), in situ observations from global, regional, and national meteorological networks, and a high-resolution climatology (CHPclim2). CHIRPS v3 spans 60°N-60°S and all longitudes. Released in early 2025, CHIRPS v3 incorporates multiple improvements from its predecessor CHIRPS v2, including increased data sources, improved estimation of precipitation variance, and a improved climatology estimate.
Key Strengths
High spatial resolution (0.05°), pentad (5-day) through annual temporal resolution, and a long historical record (1981-present) with near immediate updates.
Nearly global land coverage, including areas of complex terrain, provided by blending in-situ and satellite observations to estimate anomalies relative to a high-resolution climatology.
Rigorous quality control including automated checking of station records and expert assessment of monthly final releases.
Key Limitations
Land-only due to the need for station data and not available outside of 60°S-60°N.
The climatology is developed from thermal infrared satellite observations and is inherently uncertain and may be biased in regions with warm rains in the lower troposphere that are not captured by cloud top temperatures.
Does not directly provide daily estimates to reduce non-stationarities due to inconsistent reporting. Daily estimates are downscaled from pentadal (5-day) estimates and should be used with caution, particularly when investigating daily extremes.
Expert User Guidance
Laura Harrison, Pete Peterson, and Chris Funk also contributed to this expert guidance.
Were corrections made to account for changes in observing systems or practices, sampling density, satellite drift, or similar issues?
One fundamental challenge when working with in situ precipitation observations, especially in data sparse regions, is that the density and location of the observations can vary dramatically from month to month or even day to day. These shifts can create non-stationary systematic errors in which precipitation estimates can jump up or down in response to the changing distribution of reporting stations. For example, in many tropical and subtropical countries, higher elevation locations tend to receive more precipitation. If a high elevation station or low elevation station appears or disappears from the record, a large shift up or down can occur. This can cause spurious trends to appear and/or result in extreme events being missed or misreported. Non-stationary systematic errors can be very problematic. Because they are non-random (systematic), averaging in space and time may amplify rather than reduce them. But because they are non-stationary and their characteristics situationally vary, they cannot be removed easily.
Since it was designed for hazard detection, special care has been taken in developing CHIRPS so that it provides a long homogeneous data record that is well-suited to tracking extremes - especially at seasonal time-scales. To reduce the influence of inhomogeneities in station networks, it helps to use a background field and express station observations as differences from the background. Many gridded precipitation observation datasets use a background climatology. CHIRPS goes beyond this, by perturbing the long term climatology using satellite observations. Then the station observations are blended with the CHIRP fields. More details discussing drought early warning and non-stationary systematic errors can be found in Section 8.2 (page 123) of our book on Drought Early Warning and Monitoring.
How useful are these data for characterizing means as well as extremes?
By construction, the CHIRPS products do a very good job of characterizing means, because they explicitly build on satellite-enhanced high resolution mean fields (Funk et al. 2015B). In the new CHPclim that was used for CHIRPS v3, CHC received about 80,000 new gauge-undercatch corrected precipitation normals through a partnership with the Global Precipitation Climatology Centre (GPCC), and these were incorporated into the climatology for higher accuracy. Accordingly, in CHIRPS v3 a gauge undercatch adjustment is applied to all station data. This has increased precipitation values as compared to the CHIRPS v2 products that do not use that adjustment.
In the CHIRP3 used for CHIRPS v3, changes were made to the estimation algorithm to address a CHIRP2 tendency to underestimate temporal precipitation variance. The result is that CHIRPS v3 is better equipped for estimating the magnitudes of extreme precipitation events. Additionally, the ability to estimate local extremes in some regions is improved in CHIRPS v3 by the dataset using nearly four times the number of sources originally used in CHIRPS v2. CHIRPS v3 uses over 90 sources of station data.
What are the typical research applications of this data set?
CHIRPS v3 is expected to support a wide range of climatological and hydrological applications, particularly those requiring high-resolution data and long historical records. CHIRPS v3 became available to the public in 2025. Given the similarities between CHIRPS v3 and CHIRPS v2, which has been widely used for research and operations, the applications of CHIRPS v3 will likely align closely with those of the earlier version.
More than 7,000 published studies have used CHIRPS v2 to study spatial patterns of rainfall, regional and local scale climatic variability and change (e.g. Funk et al., 2015, Funk et al., 2018, Harrison et al., 2019, Shukla et al., 2021), climate and health (Grace and Davenport, 2021), crop yield forecasting (Davenport et al., 2024), and computation of hydrological indices (Turner et al. 2022, Gebrechorkos et al., 2023). These established applications provide a strong foundation for CHIRPS v3 to further advance research in these areas.
In addition to its extensive use in climate and hydrological research, CHIRPS v2 has also been valuable for operational applications. Beyond the scientific community, private companies, government, and humanitarian agencies rely on CHIRPS v2 for index insurance and for routine drought monitoring and early response efforts. Some of these monitoring reports can be accessed here. Due to its low latency and good performance, it has been incorporated into precipitation monitoring and drought early warning resources at organizations such as the U.S. Geological Survey, National Aeronautics and Space Administration, U.S. Department of Agriculture Foreign Agricultural Service, and the GEOGLAM Crop Monitor. It has also been used to produce operational CHIRPS-GEFS bias-corrected precipitation forecast data (Harrison et al., 2022) that can also be paired with CHIRPS to support forecast-based impact assessments.
What are the most common mistakes that users encounter when processing or interpreting these data?
One common mistake can be assuming that daily CHIRPS data can be used in place of daily gauge-based precipitation observations. While gridded data is valuable, multiple information sources are used for CHIRPS data, and station reports are blended in with these. This means that exact values of in situ daily reports are not directly replicated in the gridded data. The primary data accumulation period for CHIRPS is at pentadal (~5 day) and monthly timescales. Daily CHIRPS data are downscaled from pentadal data, with pentadal totals partitioned into daily time steps using the fraction of cold clouds in each day to do the partitioning. While validation studies have identified good performance of CHIRPS in multiple metrics, CHIRPS data, by construction, is less able to accurately capture extreme observed precipitation values at daily time steps.
What are some comparable data sets, if any?
Similar satellite-based products include the Global Precipitation Climatology Project (GPCP) (Adler et al., 2018), the African Rainfall Climatology version 2 (ARC2) (Novella and Thiaw, 2013), the Tropical Applications of Meteorology using Satellite data (TAMSAT) (Maidment et al., 2017), Precipitation Estimation from Remotely Sensed Information using Artificial Neural Networks (PERSIANN) (Ashouri et al., 2015) and the Integrated Multi-satellitE Retrievals for the Global Precipitation Measurement (IMERG) (Huffman et al., 2020).
CHIRPS also bears similarities to the high-quality station-only Global Precipitation Climatology Centre gridded precipitation products (GPCC). Since 2010, however, the CHIRPS v3 product contains substantially more stations than the GPCC and this gap is especially marked since 2016 (Figure 1).
How do I access these data?
CHIRPS v3 is available for download from the University of California Santa Barbara (UCSB) Climate Hazards Center (CHC) data repository. The data is available in pentadal, dekadal, monthly (Figure 2), and annual timeframes.
CHIRPS data can also be accessed via an online user-friendly interactive tool – the Early Warning Explorer (EWX). EWX allows users to visualize, subset, plot time series, and download maps (Figure 3).
How does one best compare these data with model output?
When comparing CHIRPS v3 with station data, users may fail to account for gauge-undercatch. Since CHIRPS v3 is gauge-undercatch corrected, the CHC recommends using gauge-undercatch corrected station observations. Legates (Legates et al., 1999) monthly scaling grids are available for download here.
To compare CHIRPS v3 with model outputs, it is important to account for differences in spatial and temporal resolutions. Regridding one dataset to match the spatial resolution of the comparison dataset is essential. Depending on the analysis, a meaningful comparison of station observations to the gridded precipitation estimates will require converting point measurements to areal averages. Several studies have compared the performance of CHIRPS v2 with model outputs, station data, and other satellite-based products (e.g. Dinku et al., 2018, Gebrechorkos et al., 2018, Harrison et al., 2019).
How frequently are the data updated?
CHIRPS v3 data are produced in two phases:
I. CHIRPS v3 Preliminary – A rapid preliminary version that incorporates readily available in situ observations including reports from the World Meteorological Organization (WMO) Global Telecommunications System (GTS), NOAA’s Global Historical Climatology Network (GHCN) and Global Summary of the Day (GSOD). Additional sources cover Mexico, Costa Rica, Colombia, Republic of Korea, South America, Guatemala, Chile, Germany and Kenya. CHIRPS v3 Prelim is updated two days after the end of a pentad on the 2nd, 7th, 12th, 17th, 22nd, and 27th of the month. It is worth noting that CHIRPS v2 Prelim has at most two sources of station data, GTS and Conagua-Mexico.
II. CHIRPS v3 Final – A product produced once/month that blends in the best available station data with the CHIRP3 data. CHIRPS Final data is produced monthly and includes the final pentadal estimates as well. Data for the previous month are typically released during the third week.
Are there spurious (non-climatic) features in the temporal record?
For Thermal Infrared Cold Cloud Duration-based precipitation estimates, the use of GridSat IR data instead of CPC IR data before 2000 may introduce characteristics that are inconsistent with the rest of the record. Specifically, the CPC IR data is of finer resolution compared to the legacy GridSat-B1 data and may better capture rainfall events. Users should also be aware of notable gaps in satellite coverage in the historical period, especially over Africa in the early 1980s, and over Central Asia through 1997. While this area is gap-filled in CHIRP data, there is a distinct data artifact that impacts historical analyses of the gap period.
CHIRPS v3 undergoes rigorous quality control measures to minimize spurious features and ensure an accurate and reliable dataset. Similar to CHIRPS v2, station inputs in CHIRPS v3 pass through a series of automated screening processes designed to detect potential errors before they enter the processing stream. These checks help identify errors such as false zeros and artificial wet events.
In addition to the automatic screening, human visual inspection (Reality Checks) is also used to validate the product before final production. In these Reality Checks, analysts look for especially anomalous estimates and aim to corroborate these with other data products, online news, and regional agrometeorological reports. The goal is to identify inaccurate station reports and omit these before they are blended into the CHIRPS final data. See the CHIRPS3 Diagnostics page for more information about the quality control process and various diagnostic products.
How is uncertainty characterized in these data?
Precipitation estimates are often influenced by uncertainties such as satellite coverage gaps, station observation gaps, and low station densities, among other factors. There are several procedures used in CHIRPS data creation for managing and reducing various aspects of uncertainties.
For example, when interpolating station data into continuous gridded precipitation estimates, areas with low station density tend to have higher uncertainty due to fewer observations. To support users in evaluating this uncertainty, CHC provides gridded station density files, which quantify the geographic and temporal station coverage characteristics. Station locations can also be viewed here. Users can also compare CHIRPS with the satellite-only CHIRP product to assess the influence of in situ station observations in their area of interest. These statistics can be found here. A more detailed summary of the CHIRPS quality control process and diagnostics tools can be found here.
What are the key limitations of this data set?
All satellite-based precipitation estimates are uncertain. CHIRP, the climatology component of CHIRPS that is satellite-based, uses thermal infrared observations from geostationary satellites to calculate the duration of ‘cold cloud’ conditions. These are indirectly related to precipitation amounts. Infrared measurements can fail to identify warm rains in the lower troposphere. Accuracy varies across locations and seasons, depending on the precipitation mechanisms. Furthermore, while geostationary satellite data used in CHIRP are from climate data records that are quality controlled and inter-calibrated, inconsistent coverage through time can still lead to data artifacts and uncertainty in estimates.
Cite this page
Acknowledgement of any material taken from or knowledge gained from this page is appreciated:
Alaso, Daniella & National Center for Atmospheric Research Staff (Eds). Last modified "The Climate Data Guide: CHIRPS: Climate Hazards InfraRed Precipitation with Station data (Version 3).” Retrieved from https://climatedataguide.ucar.edu/climate-data/chirps-climate-hazards-infrared-precipitation-station-data-version-3 on 2026-07-07.
Citation of datasets is separate and should be done according to the data providers' instructions. If known to us, data citation instructions are given in the Data Access section, above.
Acknowledgement of the Climate Data Guide project is also appreciated:
Schneider, D. P., C. Deser, J. Fasullo, and K. E. Trenberth, 2013: Climate Data Guide Spurs Discovery and Understanding. Eos Trans. AGU, 94, 121–122, https://doi.org/10.1002/2013eo130001
Key Figures

Figure 1: Monthly station counts for CHIRPS v2, CHIRPS v3 and GPCC Full v2022 from 1980 to 2024 in thousands.
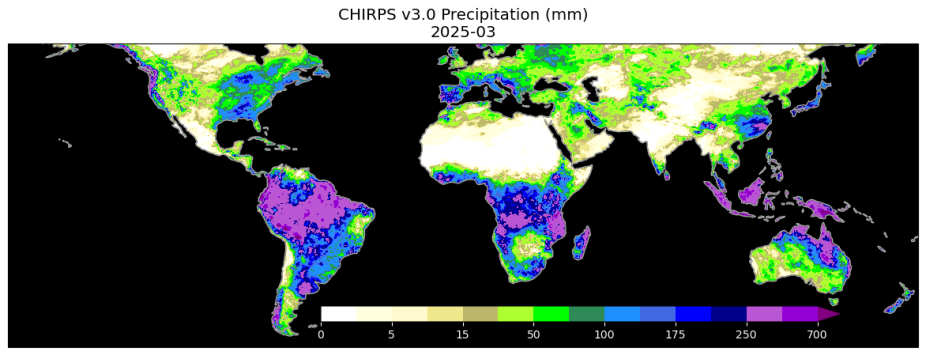
Figure 2: CHIRPS v3 global monthly precipitation totals for March 2025

Figure 3: A side-by-side comparison of CHIRPS v2 (left) and CHIRPS v3 (right) January 2025 monthly rainfall totals for Central America using the Early Warning Explorer (EWX) tool.
Other Information
- Adler, R. F., Sapiano, M. R., Huffman, G. J., Wang, J. J., Gu, G., Bolvin, D., ... & Shin, D. B. (2018). The Global Precipitation Climatology Project (GPCP) monthly analysis (new version 2.3) and a review of 2017 global precipitation. Atmosphere, 9(4), 13
- Ashouri, H., Hsu, K. L., Sorooshian, S., Braithwaite, D. K., Knapp, K. R., Cecil, L. D., ... & Prat, O. P. (2015). PERSIANN-CDR: Daily precipitation climate data record from multisatellite observations for hydrological and climate studies. Bulletin of the
- Davenport, F., Lee, D., Shukla, S., Husak, G., Funk, C., Budde, M., & Rowland, J. (2024). Testing spatial out-of-sample area of influence for grain forecasting models. Environmental Research Letters, 19(11), 114079.
- Dinku, T., Funk, C., Peterson, P., Maidment, R., Tadesse, T., Gadain, H., & Ceccato, P. (2018). Validation of the CHIRPS satellite rainfall estimates over eastern Africa. Quarterly Journal of the Royal Meteorological Society, 144, 292-312.
- Funk, C., Peterson, P., Landsfeld, M., Pedreros, D., Verdin, J., Shukla, S., ... & Michaelsen, J. (2015). The climate hazards infrared precipitation with stations—a new environmental record for monitoring extremes. Scientific data, 2(1), 1-21.
- Funk, C., Verdin, A., Michaelsen, J., Peterson, P., Pedreros, D., & Husak, G. (2015B). A global satellite-assisted precipitation climatology. Earth System Science Data, 7(2), 275-287.
- Funk, C., Harrison, L., Shukla, S., ... & Verdin, J. (2018). Examining the role of unusually warm Indo‐Pacific sea‐surface temperatures in recent African droughts. Quarterly Journal of the Royal Meteorological Society, 144, 360-383.
- Funk, C., & Shukla, S. (2020). Drought early warning and forecasting: theory and practice. Elsevier.
- Grace, K., & Davenport, F. (2021). Climate variability and health in extremely vulnerable communities: investigating variations in surface water conditions and food security in the West African Sahel. Population and Environment, 42(4), 553-577.
- Gebrechorkos, S. H., Hülsmann, S., & Bernhofer, C. (2018). Evaluation of multiple climate data sources for managing environmental resources in East Africa. Hydrology and Earth System Sciences, 22(8), 4547-4564.
- Gebrechorkos, S. H., Peng, J., Dyer, E., Miralles, D. G., Vicente-Serrano, S. M., Funk, C., ... & Dadson, S. J. (2023). Global high-resolution drought indices for 1981–2022. Earth System Science Data Discussions, 2023, 1-28.
- Harrison, L., Funk, C., & Peterson, P. (2019). Identifying changing precipitation extremes in Sub-Saharan Africa with gauge and satellite products. Environmental Research Letters, 14(8), 085007.
- Harrison, L., Landsfeld, M., Husak, G., Davenport, F., Shukla, S., Turner, W., ... & Funk, C. (2022). Advancing early warning capabilities with CHIRPS-compatible NCEP GEFS precipitation forecasts. Scientific Data, 9(1), 375.
- Huffman, G. J., Bolvin, D. T., Braithwaite, D.,... & Xie, P. (2020). Integrated multi-satellite retrievals for the global precipitation measurement (GPM) mission (IMERG). Satellite precipitation measurement: Volume 1, 343-353.
- Legates, D. R., & McCabe Jr, G. J. (1999). Evaluating the use of “goodness‐of‐fit” measures in hydrologic and hydroclimatic model validation. Water resources research, 35(1), 233-241.
- Maidment, R. I., Grimes, D., Black, E., Tarnavsky, E., Young, M., Greatrex, H., ... & Alcántara, E. M. U. (2017). A new, long-term daily satellite-based rainfall dataset for operational monitoring in Africa. Scientific data, 4(1), 1-19.
- Novella, N. S., & Thiaw, W. M. (2013). African rainfall climatology version 2 for famine early warning systems. Journal of Applied meteorology and Climatology, 52(3), 588-606.
- Shukla, S., Husak, G., Turner, W., Davenport, F., Funk, C., Harrison, L., & Krell, N. (2021). A slow rainy season onset is a reliable harbinger of drought in most food insecure regions in Sub-Saharan Africa. Plos one, 16(1), e0242883.
- Turner, W. A., Husak, G., Funk, C., Roberts, D. A., & Jones, C. (2022). An improved climatological forecast method for projecting end-of-season Water Requirement Satisfaction Index. Journal of Hydrometeorology, 23(8), 1281-1295.