CRU sc-PDSI (self-calibrating PDSI) over Europe & North America
Key Strengths
Key Limitations
Cite this page
Acknowledgement of any material taken from or knowledge gained from this page is appreciated:
National Center for Atmospheric Research Staff (Eds). Last modified "The Climate Data Guide: CRU sc-PDSI (self-calibrating PDSI) over Europe & North America.” Retrieved from https://climatedataguide.ucar.edu/climate-data/cru-sc-pdsi-self-calibrating-pdsi-over-europe-north-america on 2026-07-14.
Citation of datasets is separate and should be done according to the data providers' instructions. If known to us, data citation instructions are given in the Data Access section, above.
Acknowledgement of the Climate Data Guide project is also appreciated:
Schneider, D. P., C. Deser, J. Fasullo, and K. E. Trenberth, 2013: Climate Data Guide Spurs Discovery and Understanding. Eos Trans. AGU, 94, 121–122, https://doi.org/10.1002/2013eo130001
Key Figures
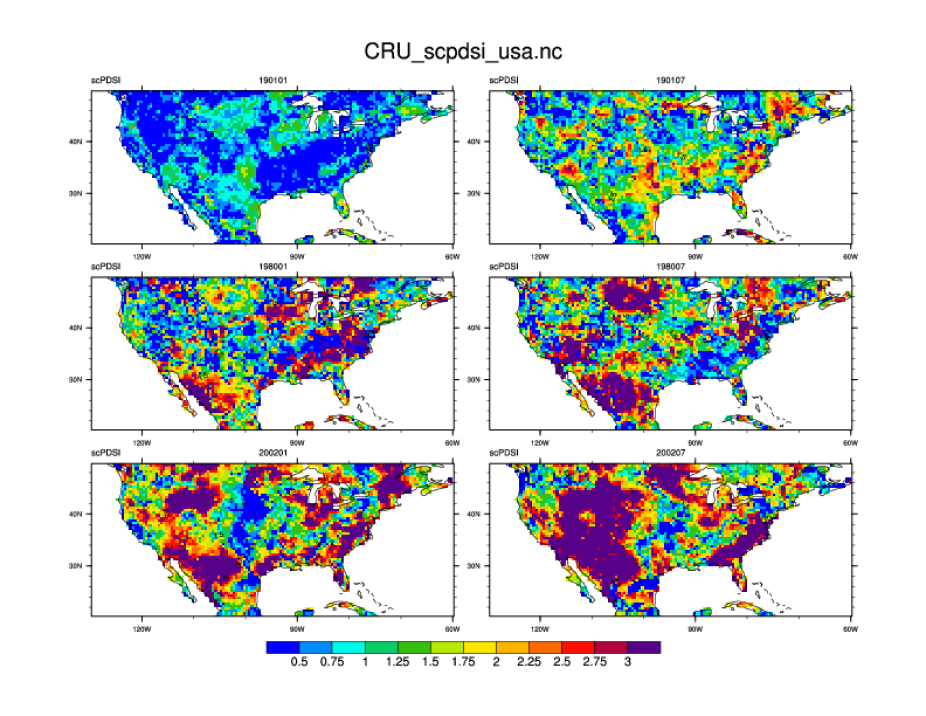
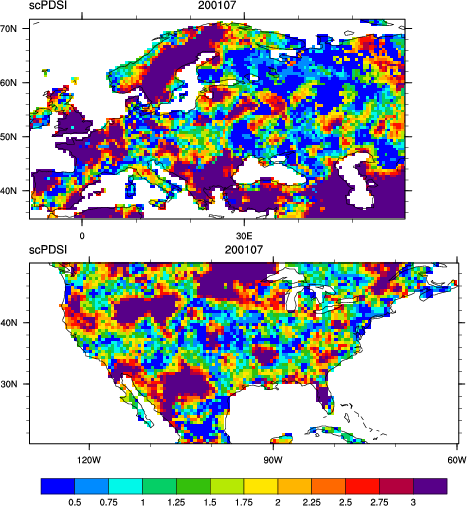
CRU self calibrating PDSI for assorted months over the USA. (Climate Data Guide; D. Shea)
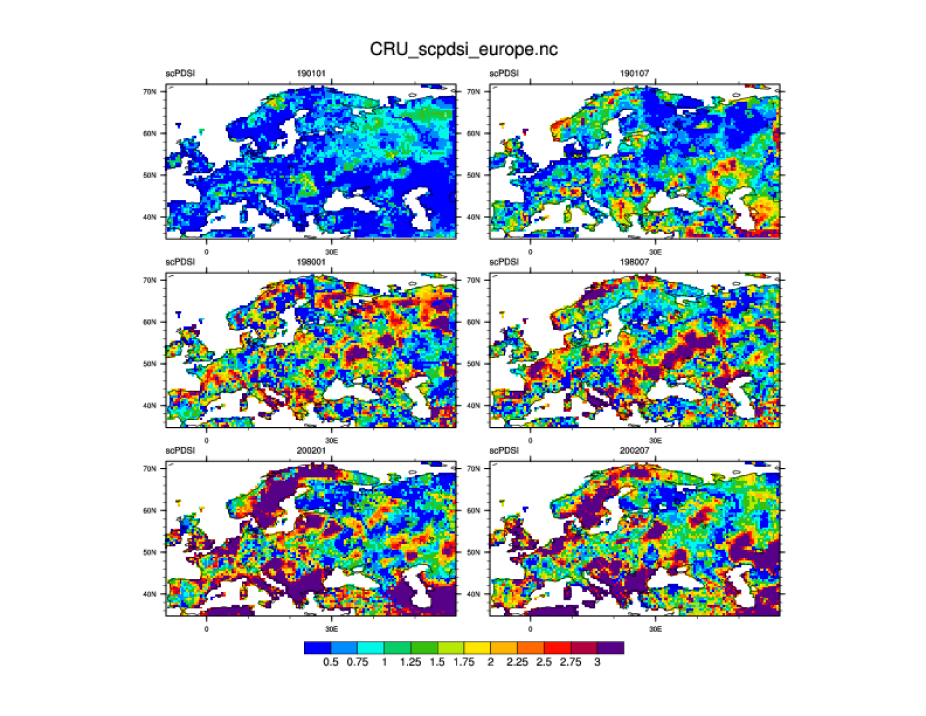
CRU self calibrating PDSI for assorted months over Europe. (Climate Data Guide; D. Shea)
Other Information
- van der Schrier G, Briffa KR, Jones PD and Osborn TJ (2006a) Summer moisture variability across Europe. Journal of Climate 19, 2818-2834
- van der Schrier G, Briffa KR, Osborn TJ and Cook ER (2006b) Summer moisture availability across North America. Journal of Geophysical Research 111, D11102
- Wells, N., Goddard, S. and Hayes, M. J. (2004) A Self-Calibrating Palmer Drought Severity Index, J. Climate 17:2335-2351
- Mitchell TD and Jones PD (2005) An improved method of constructing a database of monthly climate observations and associated high-resolution grids. International Journal of Climatology 25, 693-712