Standardized Precipitation Index (SPI)
The Standardized Precipitation Index (SPI) is a widely used index to characterize meteorological drought on a range of timescales. On short timescales, the SPI is closely related to soil moisture, while at longer timescales, the SPI can be related to groundwater and reservoir storage. The SPI can be compared across regions with markedly different climates. It quantifies observed precipitation as a standardized departure from a selected probability distribution function that models the raw precipitation data. The raw precipitation data are typically fitted to a gamma or a Pearson Type III distribution, and then transformed to a normal distribution. The SPI values can be interpreted as the number of standard deviations by which the observed anomaly deviates from the long-term mean. The SPI can be created for differing periods of 1-to-36 months, using monthly input data. For the operational community, the SPI has been recognized as the standard index that should be available worldwide for quantifying and reporting meteorological drought. Concerns have been raised about the utility of the SPI as a measure of changes in drought associated with increasing global temperature, as it does not deal with changes in evapotranspiration. Alternative indices that deal with evapotranspiration have been proposed (see SPEI).
Key Strengths
Uses precipitation only; can characterize drought or abnormal wetness at different time scales which correspond with the time availability of different water resources (e.g. soil moisture, snowpack, groundwater, river discharge and reservoir storage)
More comparable across regions with different climates than the Palmer Severity Drought Index (PDSI)
Less complex to calculate than the PDSI
Key Limitations
As a measure of water supply only, the SPI does not account for evapotranspiration, and this limits its ability to capture the effect of increased temperatures on moisture demand and availability
Sensitive to the quantity and reliability of the data used to fit the distribution; 30-50 years recommended
Does not consider the intensity of precipitation and its potential impacts on runoff, streamflow, and water availability within the system of interest
- Plots and archive of SPI for contiguous US back to 2003, High Plains Regional Climate Center
- Gridded Standardized Precipitation Index (SPI) for Global Land Surface (1949-2012) generated from CRU 3.21
- NCL tool for calculating SPI
- SPI tools at National Drought Mitigation Center
- Current SPI maps and tabular data for North America (NCDC)
Expert User Guidance
The following was contributed by Dr. John Keyantash, California State University, Dominguez Hills, January, 2014:
The Standardized Precipitation Index (SPI) is a widely accepted index for the quantification of drought. In fact, the SPI was recommended through the Lincoln Declaration on Drought as the internationally preferred index for meteorological drought (Hayes et al., 2011). The SPI specifically addresses the intensity of meteorological drought, or precipitation deficit. The shortage of precipitation is a fundamental, intuitive metric for drought—perhaps the most basic description possible. However, interpreting the magnitude of the precipitation deficit can be challenging, because precipitation climatology varies widely over geographical regions as well as temporal scales. For example, when an unusually wet month is embedded within a period of extended drought, should the month be considered droughty or not? Furthermore, the level of the precipitation deficit/excess should be judged relative to some climatological norm for the location. Thus the challenge of drought definition lies not in the raw measurement of hydrometeorological data, but instead the objective assessment of the observations.
The SPI addresses this challenge by comparing the precipitation total for the chosen interval against a cumulative probability distribution for the precipitation data (for the identical interval). For example, what is statistical interpretation of the one-month precipitation total (e.g., 29 mm), compared to all known one-month totals? Obviously, the geographic location and time of year are important restrictions; if the precipitation was during April 2005 in southwestern Idaho, its magnitude should only be judged against April data from other years, in southwestern Idaho. Thus, it is necessary to view the drought according to the climatological norms for the location and season.
The SPI can compute drought intensity over any desired interval, e.g., one month, five months or 200 days. However, one of the most powerful features of the SPI is its intrinsic ability to simultaneously assess drought over a suite of timescales. For example, the precipitation totals for one, three, six, 12, 18, 24, 36, 48, and 60 month durations are routinely used by researchers to compute the SPI for the same respective intervals. A plot of SPI values from southwestern Idaho, for two different timescales, is shown in the first figure.
The SPI can accomplish the simultaneous assessment of drought because the observed precipitation during each time period is considered a statistical sample from a larger parent population. That is, each precipitation observation can be considered as a single datum—a random sample—from the broader precipitation probability distribution. For computational accuracy, Guttman (1999) recommends a minimum of 50 years of precipitation data. Observational data need not be preprocessed into the desired aggregations; available software codes (such as available from the National Drought Mitigation Center [NDMC]) accept monthly input data (which is usually the minimum interval frequency used to study drought [i.e., the one-month SPI]) and aggregate it to desired intervals (e.g., six month precipitation, for the six month SPI).
Precipitation is known to follow an asymmetric frequency distribution, with the bulk of the occurrences at low values, and a rapidly decreasing likelihood of larger precipitation totals. There are a number of such positively-skewed analytical distributions, six of which were analyzed for SPI computations by Guttman (1999). The distribution for the SPI adopted by McKee et al. (1993), as well as the NDMC, is the incomplete gamma distribution. SPI algorithms analyze the input data to optimally estimate two key coefficients which govern the transformation, and the observed precipitation data are transformed to Gaussian (normal) equivalents. The transformed precipitation data are then used to compute the dimensionless SPI value, defined as the standardized anomaly of the precipitation:
SPI = (P-P*) / σp
where P = precipitation
p* = mean precipitation
σp = standard deviation of precipitation
The dimensionless SPI values are typically associated with the drought descriptions of “dry”, “moderately dry”, or “extremely dry”, as well as other labels for near-normal conditions or precipitation excesses. The occurrence of these along the normal distribution is shown in the second figure.##
Cite this page
Acknowledgement of any material taken from or knowledge gained from this page is appreciated:
Keyantash, John & National Center for Atmospheric Research Staff (Eds). Last modified "The Climate Data Guide: Standardized Precipitation Index (SPI).” Retrieved from https://climatedataguide.ucar.edu/climate-data/standardized-precipitation-index-spi on 2026-07-02.
Citation of datasets is separate and should be done according to the data providers' instructions. If known to us, data citation instructions are given in the Data Access section, above.
Acknowledgement of the Climate Data Guide project is also appreciated:
Schneider, D. P., C. Deser, J. Fasullo, and K. E. Trenberth, 2013: Climate Data Guide Spurs Discovery and Understanding. Eos Trans. AGU, 94, 121–122, https://doi.org/10.1002/2013eo130001
Key Figures
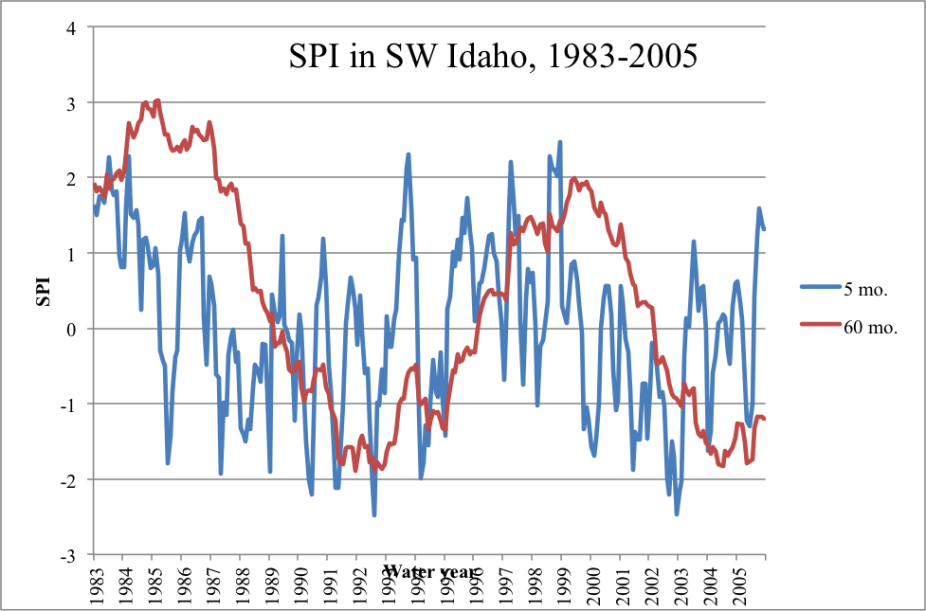
SPI values for five month and sixty month timescales, in Idaho climate zone 5 (Southwestern Valleys). The sixty month SPI clearly tracks the long-term drought pattern. The SPI parameters for the data transformation were constructed using 111 years of observations. Contributed by J. Keyantash
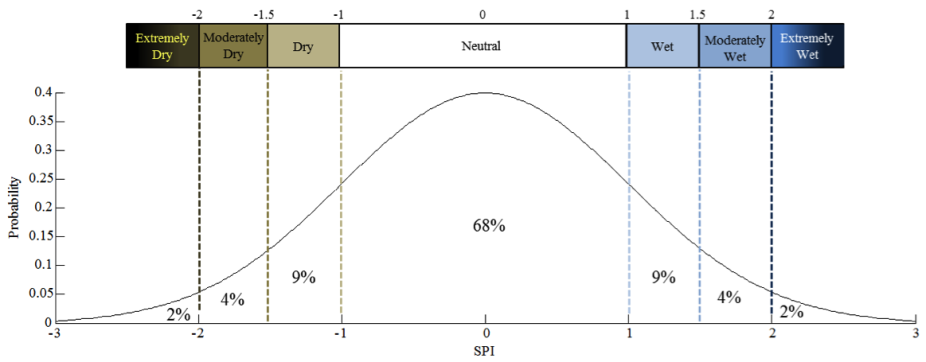
SPI labels and their relationship to the normal curve. The intensity implied by each label corresponds to the degree of removal from mean conditions (i.e., SPI=0). The percentages printed within the regions bounded by the dashed lines indicate the probability for SPI values to fall within that region only; overall cumulative probabilities require summing the probabilities from the SPI datum of interest through a tail of the curve. For example, SPI values of -1.5 or lower occur in only six percent (2% + 4%) of cases. The sum of all of the stated values is less than 100% due to rounding. Contributed by J. Keyantash.
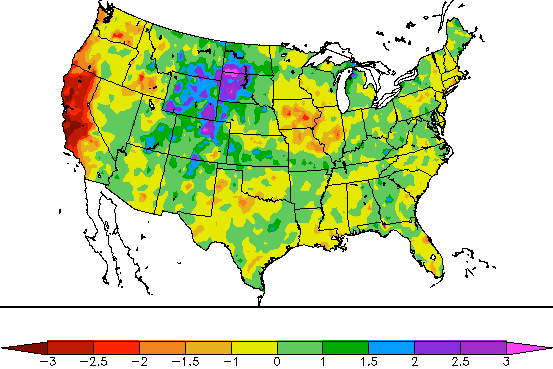
6-month SPI through January, 2014 capturing drought in California and late-summer heavy rains in the Front Range of Colorado. Retrieved on 31 January 2014 at http://www.hprcc.unl.edu/maps/current/index.php?action=update_daterange…
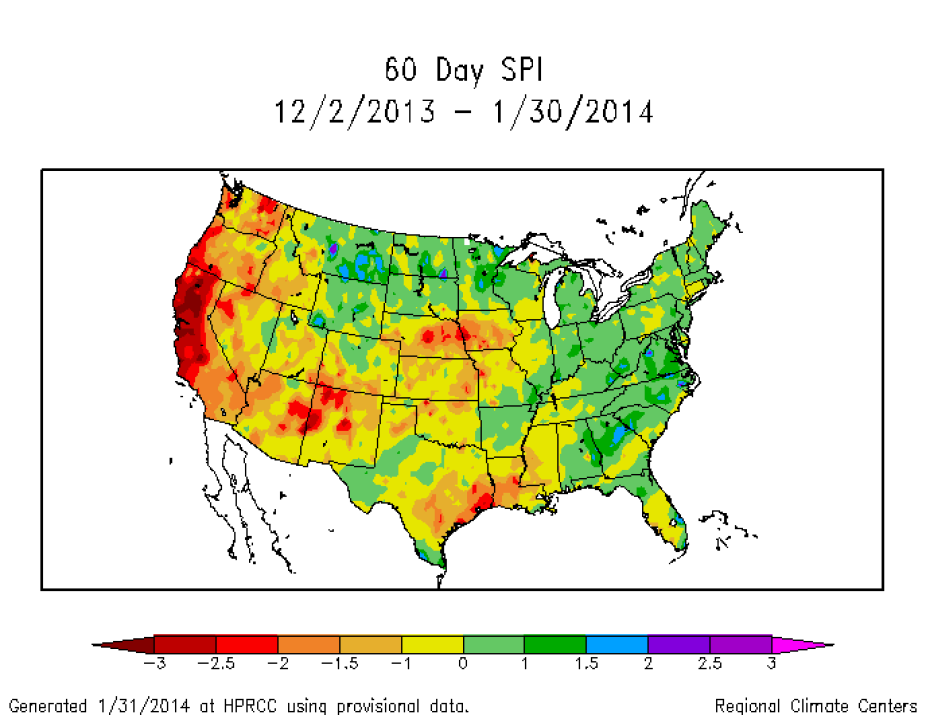
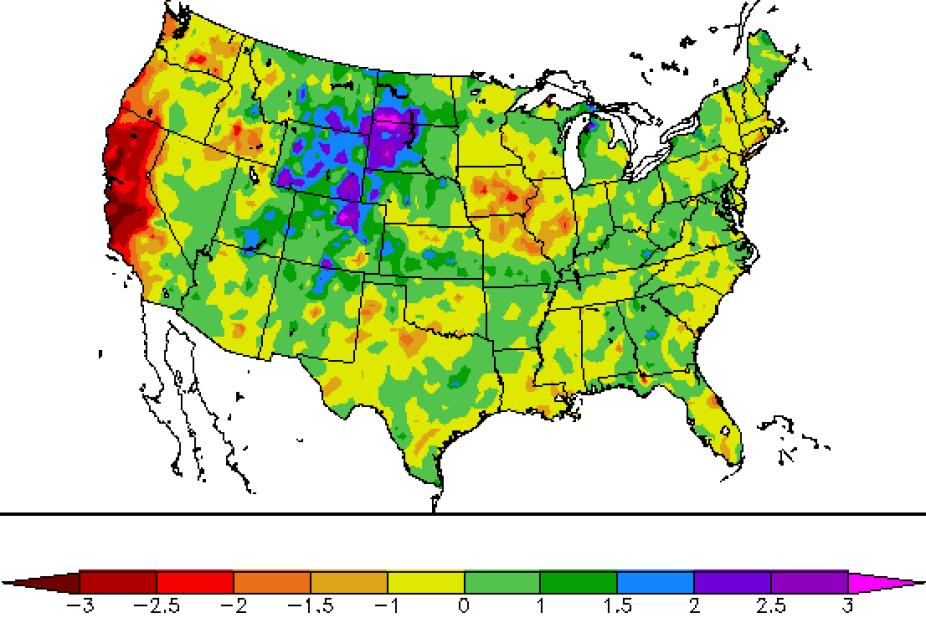
2-month SPI through January, 2014 capturing ongoing drought in California and near-normal conditions in north-central Colorado. Retrieved on 31 Jan 2014 at http://www.hprcc.unl.edu/maps/current/index.php?action=update_daterange…
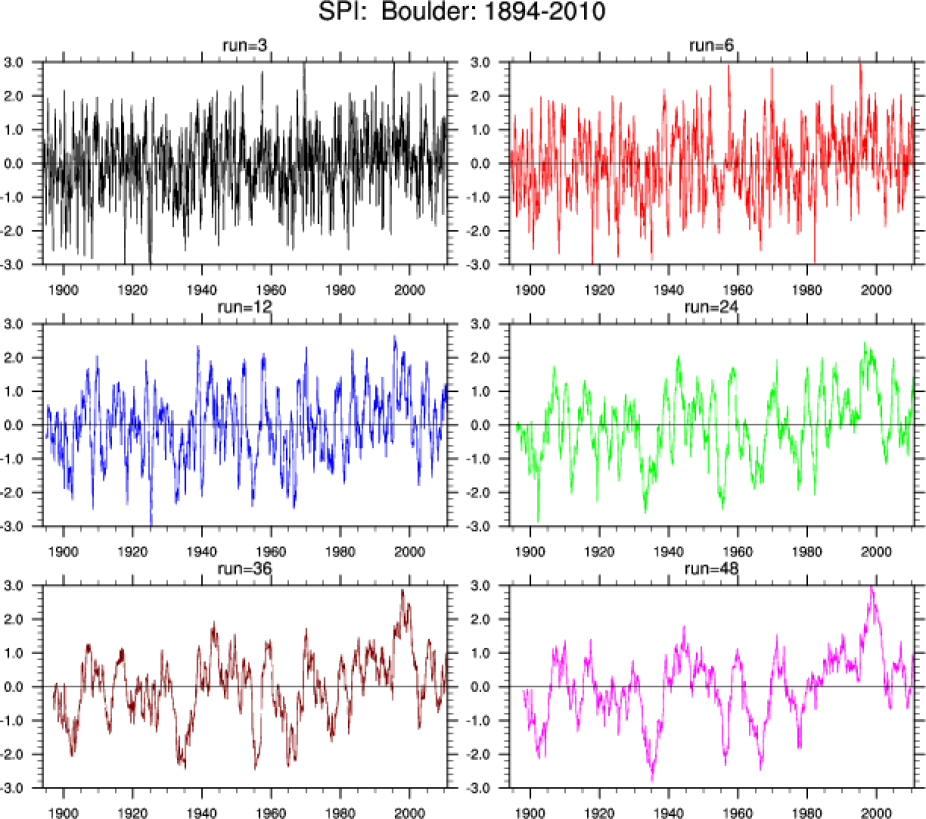
SPI at Boulder, Colorado (USA) from 1894-2010. Six run lengths were used: 3, 6, 12, 24, 36 and 48 months. The original data were from http://www.esrl.noaa.gov/psd/boulder/ (Climate Data Guide; D. Shea)

SPI for lengths of 3, 6 and 12 months from "Standardized Precipitation Index (SPI) for Global Land Surface (1949-2012)." (Climate Data Guide: D. Shea)