IMERG precipitation algorithm and the Global Precipitation Measurement (GPM) Mission
IMERG (Integrated Multi-satellitE Retrievals for the Global Precipitation Measurement) is NASA's updated precipitation algorithm, while the Global Precipitation Measurement (GPM) mission is an international satellite mission launched by NASA and JAXA on Feb. 27, 2014. The GPM is a follow on to the TRMM satellite mission. NASA have applied the IMERG algorithm to both TRMM-era and GPM-era data, creating a relatively long (20+ years), high spatial (0.1 degree) and temporal (30 minute) resolution satellite-based precipitation record with global coverage (but of limited value in the polar regions).
IMERG is being used to produce a suite of data products; climate research users will probably most be interested in the "Final Run," which is described in Dr. George's Huffman's Expert Guidance here. Researchers primarily interested in low-frequency variability or long-term trends will most likely want to look at the GPCP data products, either on their own or in tandem with IMERG products. As described in Dr. Jackson Tan's guidance, below, IMERG is also offered in "Early Run" and "Late run" versions with simplified versions of the algorithms; the Early Run is available with just a 4-hour latency.
Key Strengths
High spatial and temporal resolution over a fairly long (20+ years) time period
IMERG detects light rain and falling snow better than previous algorithms like TMPA
IMERG strives to provide the best instantaneous precipitation estimates
Key Limitations
As IMERG depends on a varying group of "satellites of opportunity," the temporal record may not be homogeneous. Users investigating time series behaviour (e.g. long-term trends, power spectra, etc.) should consider evaluating data products like GPCP, which emphasize temporal homogeneity.
Satellite algorithms in general emphasize "most likely" statistics. Studies of extreme events need to be mindful of what information these data products can realistically provide.
Significant data latency for the production of the "Final Run" IMERG data product
Expert Developer Guidance
The following was contributed by Dr. Jackson Tan, June, 2023:
The broad concept of IMERG is to take advantage of the available satellite constellation capable of observing precipitation, using the Global Precipitation Measurement (GPM) and Tropical Rainfall Measuring Mission (TRMM) satellites as the calibration reference, to produce a gridded precipitation product at a high resolution that caters to users with different latency requirements.
Specifically, IMERG produces observed estimates of precipitation at 0.1° every half-hour globally from 2000 to the present day. (Efforts to extend the starting year to 1998 are ongoing.) This is achieved by gridding the passive microwave (PMW) precipitation estimates—which are more direct and hence high-quality retrievals—and calibrating them to the combined radar-radiometer product from the GPM and TRMM satellites. Being on low-Earth orbits, the coverage at any half-hour is limited, so Lagrangian interpolation is applied to the PMW estimates by propagating them forward and backward in time using motion vectors. These estimates, together with the lower-quality infrared (IR) precipitation estimates, are then combined at each grid box using a Kalman filter. Finally, a broad-scale bias adjustment to gauge analysis is applied over land.
Recognizing that different users have different latency requirements, IMERG is produced in three “Runs”. By sacrificing or simplifying parts of the algorithm, IMERG precipitation estimates can be produced at near-real-time. Specifically, the Early Run is available at about 4-h latency by dropping backward propagation and gauge adjustment (among other minor changes), and the Late Run is available at about 12-h latency by dropping gauge adjustment. The Final Run—the research grade product with the full algorithm—is available at about a 3-month latency. As well, the IMERG algorithm natively produces half-hour estimates (and monthly estimates for the Final Run), but other derived products, such as daily precipitation estimates aggregated from the half-hour, are produced by data providers as a convenience to users.
One important aspect of the IMERG to bear in mind is that the algorithm is not static; instead, it is regularly updated and refined to improve the precipitation estimates. Currently, the latest version of IMERG is V07. The major changes include an improved intercalibration process to correct for known biases, a corrected gridding process to fix a spatial offset, an upgrade of the IR precipitation retrieval scheme to a modern algorithm, the inclusion of PMW retrievals in the Kalman filter to further improve consistency, and the removal of masking of PMW retrievals over frozen surfaces. For the full list of changes, refer to the official documentation.
What are the key strengths of this data set?
• Observation-based multi-satellite precipitation estimates at a high resolution with global coverage and a record of more than two decades, with a performance that is competitive compared to its peers according to numerous evaluation studies.
• Often better than numerical models in convective environments, including in the representation of the convective diurnal cycle of precipitation.
• Constant refinement and improvements to the algorithm based on evaluation and feedback.
What are the key limitations of this data set?
• Less accurate compared to local ground radars or gauges, and similar or worse skill compared to numerical models in cold season environments, especially for estimates over snow- or ice-covered surfaces and near orography.
• Using IMERG for climate-scale studies requires caution since the algorithm prioritizes the highest possible resolution over a consistent record. This is especially true for quantities focusing beyond mean precipitation rate (such as extreme precipitation), since changes in the constellation can introduce artificial jumps. One mitigating strategy is to look out for changes in the time-series coincident with changes in the constellation.
What are the typical research applications of this data set?
• There is a substantial body of research evaluating IMERG. Not only does this provide useful feedback to the algorithm developers, but it also gives users an idea of the accuracy of IMERG, especially in relation to other satellite products.
• IMERG has also been used to evaluate numerical models, especially in environments that it has the advantage (e.g., Argüeso et al. 2020; Naud et al. 2020; Cafaro et al. 2021; Tang et al. 2021). Numerous studies leverage the high resolution of IMERG to study fine-scale variability, such as the diurnal cycle (e.g., Watters and Battaglia 2019; Tan et al. 2019; Zhang and Xu 2021). Some studies have also used IMERG to investigate a myriad of precipitation systems (e.g., Booth et al. 2018; Boisvert et al. 2021; Tapiador et al. 2021).
• Beyond the scientific literature, IMERG is also used in a wide range of societal applications. Such applications include constructing flood maps from extreme rainfall, modeling agricultural production outlooks, planning hydropower resource, monitoring mosquito distribution, and determining microinsurance payouts. See https://gpm.nasa.gov/applications/highlights.
What are the most common mistakes that users encounter when processing or interpreting these data?
• As mentioned above, climate-scale analysis of IMERG—i.e., trends and interannual variability—must be conducted with caution, with an eye on possible artificial changes associated with changes in the constellation. Consider using GPCP (see below) if possible.
• When comparing IMERG estimates to gauges, differences in spatial and temporal representation must be considered. Specifically, there may be errors arising solely from representing the point source(s) of gauges over the area of the IMERG grid box. Similarly, there may be a temporal difference between the “daily” gauges (often based on local time of day) and the “daily” IMERG (based on UTC time).
• It is important to recognize the difference between grid spacing and effective resolution. IMERG provides estimates at 0.1° grids (~10 km) but the resolution—in the sense of ability to resolve the spatial feature—of the retrievals from the satellite sensor may be coarser (Guilloteau et al. 2017).
What are some comparable data sets, if any?
• Products with a conceptually similar multi-satellite approach are CMORPH by NOAA Climate Prediction Center (Xie et al. 2017) and GSMaP by the Japanese Aerospace Exploration Agency (Mega et al. 2019).
• A complementary product to IMERG is the Global Precipitation Climatology Project, or GPCP (Huffman 2021a,b). While it has a coarser resolution, GPCP is designed with climate-scale consistency as a priority, making it more suitable than IMERG for long-term analysis.
• Other noteworthy products include the PERSIANN family of products by UC Irvine (e.g., Nguyen et al. 2018), as well as CHIMES by UC Santa Barbara (Funk et al. 2022), which merges the IMERG Late Run with low-latency gauges to provide gauge-adjusted estimates at a 2-day latency.
How is uncertainty characterized in these data?
• Uncertainty in satellite precipitation estimates remains a longstanding issue, with the skewed distribution and high spatiotemporal variability of precipitation posing a unique challenge to the quantification of its uncertainty.
• IMERG provides two measures of uncertainty: Quality Index and random error. The Quality Index is a metric from zero to one that can be interpreted as the equivalent correlation of the estimate against the reference satellite. Evaluation suggests that the Quality Index does reflect performance on the aggregate but with appreciable variability. The random error is a metric that is computed as part of the optimal estimation in the gauge adjustment process, but its usefulness as a quantitative measure remains limited.
• There are ongoing efforts to explore possible improvements to the representation and quantification of the uncertainties (e.g., Wright et al. 2017; Li et al. 2023).
Were corrections made to account for changes in observing systems or practices, sampling density, satellite drift, or similar issues? Are there spurious (non-climatic) features in the temporal record?
• A key focus in IMERG is proper calibration, which helps reduce differences between sensors. As well, intersensor differences are reduced in different way, such as the inclusion of the instantaneous passive microwave estimates in the Kalman filter.
• However, the GPM constellation is a constellation of opportunity—using all sensors that are available—and IMERG is not a Climate Data Record. Consequently, there may be artificial changes associated with a changing constellation.
• For a precipitation Climate Data Record, there are alternative products for which long-term consistency is a design priority. See, for example, GPCP above.
How useful are these data for characterizing means as well as extremes?
• For mean precipitation, which is a central target in the calibration process, confidence in its reliability is reasonably high.
• For extreme precipitation, there are increased uncertainties, due to (i) the highly skewed nature of precipitation distribution, (ii) the dependence of precipitation distribution on satellite footprint resolution which generally improves over time, and (iii) the Bayesian nature of the PMW retrieval scheme which tends to approach the mean in its solution (see Petković et al. 2018).
How does one best compare these data with model output?
• Comparisons should keep in mind the relative uncertainties of observed precipitation and model precipitation: IMERG tends to outperform model in convective situations whereas its skill is more questionable in cold season environments.
• There is a wide body of literature comparing IMERG to ground observations—as well as rich ground observations—that can be of use to model evaluations. Specifically, such IMERG–ground comparisons can determine the uncertainty of IMERG, against which model evaluations can be compared.
• More generally—beyond just comparison with models—users should apply bias correction based on ground observations if feasible and watch out for artificial changes (or jumps) in the record.
How do I access these data? How frequently are the data updated? Can you recommend any cloud platforms and/or online plotting tools where one can visualize and interact with these data?
• IMERG data is produced by PPS and also archived by GES DISC. The best source of data is via the data directory on the GPM website: https://gpm.nasa.gov/data/directory.
• IMERG has three Runs to cater to different latency requirements and are updated regularly. The Final Run, with an approximately 3-month latency, is updated every month. The Late and Early Runs, with about 12-hour and 4-hour latencies respectively, are updated every hour.
• IMERG data is archive on GES DISC, which is also available on the cloud via Amazon’s S3 access. GES DISC also maintains the Giovanni tool, which allows for some basic analysis of the data.
Please point to those resources, as well as share a few figures from your own work. Is there any publicly available code that illustrates how to access and analyze these data? If so, where?
• The IMERG file format is HDF5 (which is compatible with netCDF4) with embedded metadata, so it can easily be read by major programming languages.
• The GPM website has some basic tutorials and sample codes on using various tools to access and analyze IMERG data: https://gpm.nasa.gov/data/tutorials.
_____
The following was contributed by George J. Huffman, September, 2022:
Suitability for Climate Research
A long-term, near-global gridded precipitation dataset may be categorized as a High-Resolution Precipitation Product (HRPP), which strives to provide the best instantaneous precip estimates, or as a Climate Data Record (CDR), which emphasizes homogeneity over instantaneous accuracy. Of course, each approach tries to maintain the “other” goal, but it is secondary. The Integrated Multi-satellitE Retrievals for the Global Precipitation Measurement (GPM) mission (IMERG) is an HRPP, while the GPCP conforms to CDR standards. As such, IMERG depends on a continuously varying “virtual constellation” of satellites of opportunity, currently some 11 microwave satellites operated by 6 agencies. Particularly early in the IMERG record, there were relatively few microwave satellites. The flip side of this is that the early part of the IMERG record has more dependence on microwave-calibrated IR estimates, and the IR coverage declines after the first few years. Such variations should steer users away from IMERG to the GPCP for climate studies. Additionally, IMERG’s ~20-year record is really not sufficient for studies of long-term trends. On the other hand, analyzing IMERG in parallel with the GPCP can give some insight by confirming particular results or not. One result that is nearly automatic is that the GPCP and IMERG agree rather closely at the monthly scale over most land areas because they both use the same GPCC monthly gauge analyses, and in similar ways. As well, it is likely that the climatological statistics provided by IMERG, including the histogram of fine-scale precipitation rates and aggregations thereof, are likely stable. The issue of the changing constellation of inputs is more problematic for trying to characterize time-varying climate parameters. Finally, precipitation analyses in general, and satellite algorithms specifically, emphasize some version of “most likely” statistics. This fact implies that studies of extremes need to be realistic about what these products can be asked to do.
Interpreting Precipitation Estimates as a Function of Rain Rate
If you plot observed versus satellite precipitation grid values at the full 0.1° half-hourly resolution, the skill is modest, with huge relative error at small precipitation rates. Studies show that time and/or space averaging substantially reduces the random error, characteristically collapsing the scatterplot toward the 1:1 line. The point of handing out the data at fine scales with large uncertainty is that the user has the freedom to create averages in ways that best correspond to the problem at hand. In contrast, the relatively well-behaved IMERG Final Run monthly product forces the user to use data in calendar-month units; this prohibits using a monthly average from one month’s mid-point to the next. At the fine scales in full-resolution IMERG Final Run, we usually observe that random error dominates the error budget – that is, the part of the error that averages out with sufficiently long averaging. The bias (the persistent part of the error that tends to bedevil climate studies) is hard to estimate, although we have tried to make a fair estimate of the “real” climatology for the TRMM era:
Wang, J.-J., R.F. Adler, G.J. Huffman, D.F. Bolvin, 2014: An Updated TRMM Composite Climatology of Tropical Rainfall and Its Validation. J. of Climate, 27(1), 273-284. doi: 10.1175/JCLI-D-13-00331.1 .
It is fair to say that error estimates are lagging behind where we expected them to be. One contribution to this current research topic is for the work by Maggioni and collaborators:
Maggioni, V., M.R.P. Sapiano, R.F. Adler, Y. Tian, G.J. Huffman, 2014: An Error Model for Uncertainty Quantification in High-Time Resolution Precipitation Products. J. Hydrometeor., 15(3), doi:10.1175/JHM-D-13-0112.1, 1274-1292 .
There is some hope that this approach will naturally encompass both random and bias errors. The cost is that we’re going to end up with quantiles of estimated precip at each time at each grid box. Such detail will not be suitable for all users, so we will need to continue producing a simplified error estimate as well. IMERG provides one such simple Quality Index,
https://gpm.nasa.gov/resources/documents/imerg-v06-quality-index .
The Behrangi et al. (2014) paper,
Behrangi, A., G. Stephens, R.F. Adler, G.J. Huffman, B. Lambrigtsen, M. Lebsock, 2014: An Update on Oceanic Precipitation Rate and Its Zonal Distribution in Light of Advanced Observations from Space. J. Climate, 27(11), doi: 10.1175/JCLI-D-13-00679.1, 3957-3965 ,
provides a more-quantitative view of the bias errors that we’ve long suspected. The seriousness of the results depend on which statistics you’re trying to use: how important is it to get the lightest precip rates right that give 5% of the amount, but 40% of the events, or whatever the numbers are in the area of interest? Essentially all the precip data set algorithms have focused on getting the averages right, and it’s a much more challenging problem to also get the distribution of precip rates quantitatively correct.
Algorithm and Processing
The Algorithm Theoretical Basis Document, Technical Document, referred publication, and links therein for a description of the steps involved in producing the IMERG products:
https://gpm.nasa.gov/resources/documents/algorithm-information/IMERG-V06-ATBD ;
https://gpm.nasa.gov/resources/documents/IMERG-V06-Technical-Documentation ;
Huffman, G.J., D.T. Bolvin, D. Braithwaite, K. Hsu, R. Joyce, C. Kidd, E.J. Nelkin, S. Sorooshian, E.F. Stocker, J. Tan, D.B. Wolff, P. Xie, 2020: Integrated Multi-satellitE Retrievals for the Global Precipitation Measurement (GPM) mission (IMERG). Chapter 19 in Adv. Global Change Res., Vol. 67, Satellite Precipitation Measurement, V. Levizzani, C. Kidd, D. Kirschbaum, C. Kummerow, K. Nakamura, F.J. Turk (Ed.), Springer Nature, Dordrecht, ISBN 978-3-030-24567-2 / 978-3-030-24568-9 (eBook), 343-353. doi:/10.1007/978-3-030-24568-9_19.
To summarize, GPM, and its predecessor mission, the Tropical Rainfall Measuring Mission (TRMM) are joint U.S.-Japan satellite missions to monitor quasi-global precipitation and to estimate its associated latent heating. TRMM was launched on in November, 1997, from the Tanegashima Space Center in Japan, and the GPM Core Observatory (CO) followed in February 2014. The precipitation-relevant instruments on the TRMM satellite include the Precipitation Radar (PR), an electronically scanning radar operating at 13.8 GHz (Ku band); TRMM Microwave Image (TMI), a nine-channel passive microwave radiometer; and Visible and Infrared Scanner (VIRS), a five-channel visible/infrared radiometer. The GPM CO carries the Dual-frequency Precipitation Radar (DPR), which provides both 13.8 (Ku) and 35.5 (Ka) GHz channels, and the GMI Microwave Imager (GMI), a 13-channel passive microwave radiometer.
The purpose of the IMERG Final Run algorithm is to produce TRMM-/GPM- and raingauge-adjusted multi-satellite precipitation rate (in mm/hr) and root-mean-square (RMS) precipitation-error estimates. The algorithm combines multiple independent precihttps://gpm.nasa.gov/sites/default/files/2020-10/IMERG_V06_release_notes_201006_0.pdfpitation estimates from the TMI, GMI, Advanced Microwave Scanning Radiometer for Earth Observing Systems (AMSR-E), AMSR-2, Special Sensor Microwave Imager (SSMI), Special Sensor Microwave Imager/Sounder (SSMIS), Advanced Microwave Sounding Unit (AMSU), Microwave Humidity Sounder (MHS), Advanced Technology Microwave Sounder (ATMS), Sounder for Probing Vertical Profiles of Humidity (SAPHIR), and microwave-adjusted merged geosynchronous infrared (geo-IR). All input microwave data are intercalibrated to the Combined Radar-Radiometer precipitation estimates (based on the instruments aboard TRMM for 1998-May 2014, and aboard GPM CO thereafter); the geo-IR estimates are computed using Precipitation Estimation from Remotely Sensed Information using Artificial Neural Networks – Cloud Classification System (PERSIANN-CCS; Hong et al. 2004), then calibrated using monthly matched microwave-IR precipitation histogram matching.
Following the general concept of the CMORPH-Kalman Filter (CMORPH-KF; Joyce et al. 2011), PMW overpasses are propagated forward and backward, and weighted together with PMW-calibrated geo-IR estimates to create half-hourly estimates. The Kalman Filter weights are computed dynamically by region as average correlations between the various satellites and the TMI/GMI. New for Version 06, propagation is based on movement of vertically integrated water vapor in analyses provided by the Modern-Era Retrospective Analysis for Research and Applications, Version 2 (MERRA-2)
https://gpm.nasa.gov/resources/documents/computing-morphing-vectors-version-06-imerg .
Precipitation phase is computed as a diagnostic using surface type, surface pressure, surface temperature, and surface humidity (after Sims and Liu 2015)
Sims, E.M., G. Liu, 2015: A Parameterization of the Probability of Snow–Rain Transition. J. Hydrometeor., 16, 1466–1477. doi:10.1175/JHM-D-14-0211.1 .
As such, it is globally complete, and could be used to give an estimated phase for any other precipitation dataset, whether or not its precipitation occurrence matches that shown by IMERG. User requests for a simple Quality Index (QI) led to two distinctly different QI definitions for the half-hourly and monthly data sets in Version 05, and similarly in the current Version 06,
https://gpm.nasa.gov/resources/documents/imerg-v06-quality-index .
After this processing is complete, the half-hourly multi-satellite fields are summed for the month and combined with the monthly accumulated Global Precipitation Climatology Centre (GPCC) rain gauge analysis using inverse-error-variance weighting to form a monthly best-estimate precipitation rate, which is the (native) monthly IMERG Final Run. The final step is to scale all the half-hourly estimates for the month to sum to the monthly value (for each gridbox separately). The completed IMERG Final Run precipitation (in mm/hr) estimates have a half-hourly temporal resolution and a 0.1°x0.1° spatial resolution. The spatial coverage is global, but with gaps outside the latitude band 60°N-S where the surface is snowy/icy due to uncertainties in the microwave retrievals over such surfaces and the lack of geo-IR data outside that band.
Limits are imposed on the month-to-half-hour scaling to avoid unphysical results, so particularly in low-rain areas, the half-hourly IMERG Final Run values in a month may not sum exactly to the corresponding native monthly dataset. For this reason, the native monthly dataset is preferred for providing monthly values.
Version 06 Updates
The GPM data system was designed to provide episodic, complete reprocessings of the TRMM/GPM products to take advantage of ongoing research to improve the various scientific algorithms. [Such reprocessing is now considered a best practice for data archives in general.] The latest reprocessing for GPM moved the products from Version 05 to 06, and the current data set has been processed using the Version 06 algorithms.
Quoting from the IMERG Version 06 Release Notes,
https://gpm.nasa.gov/resources/documents/imerg-v06-release-notes,
The transition to V06 for the IMERG Final Run began 13 March 2019 at PPS and the new data started flowing down to the GES DISC as well. However, on 15 March 2019 an error was discovered in processing the initial batches of V06 IMERG Final Run months. A design choice in the code ended up retaining microwave precipitation estimates in the latitude band 60°N-S when there is snow/ice on the surface, rather than masking out the estimates due to low performance in such cases. [Masking for microwave retrievals over surface snow and ice outside that band is correct.] All then-existent V06A Monthly and Half-hourly IMERG products (June 2014-December 2015) were retracted, and corrected datasets released. The GPM-era Final Run begins on 1 June 2014 to allow a spin-up of calibration files and extends to the (delayed) present. Retrospective processing for the TRMM era Final Run began on 15 April 2019. Due to IR data issues at present, the actual start of the record is June 2000 to allow spin-up of the calibration files. Initial Processing of the Early and Late Runs began on 1 May, with Retrospective Processing commencing when the Final Run was fully retrospectively processed. Version 06A supersedes all prior IMERG versions, and users are urged to shift to the new datasets as soon as practical. For more details on Version 06, see https://gpm.nasa.gov/sites/default/files/2020-10/IMERG_V06_release_notes_201006_0.pdf .
Planned Changes for Version 07
At press time, the IMERG development team was nearly done preparing the processing code for the next major release, as Version 07. Retrospective processing of the Final Run was expected to commence in November 2022, and be completed in early 2023.
There are two changes that will interrupt existing workflows using the V06 files:
- In the half-hour files, the “precipitationCal” data field will be renamed as “precipitation”.
- In the half-hour files, several other data fields will be renamed and/or reorganized; the affected V06 variable names are “precipitationUncal”, “HQprecipitation”, “HQprecipSource”, “HQobservationTime”, “IRprecipitation”, and “IRkalmanFilterWeight”.
These changes are driven primarily by persistent confusion among new users about what these variables represent.
Several algorithmic upgrades are expected to provide appreciably improved performance, including: Version 07 GPROF retrievals from PMW sensors, the SHARPEN procedure for approximately preserving regional histograms of rainrate despite the averaging intrinsic to the Kalman filter, revisions to the calibration process to control biases, correction of a gridding error that systematically shifted PMW data 0.1° to the East, and use of the new PDIR retrievals from IR data.
As things move along, the Global Precipitation Measurement mission (GPM) web site, https://gpm.nasa.gov/data/news , is the right general source for news.
As well, the GPM web site hosts has a one-stop set of web pages specifically aimed at new users, listing all of the basic and derived TRMM/GPM datasets available through Goddard Space Flight Center: https://gpm.nasa.gov/data/directory.
These pages include documentation about the data sets and algorithms, and contact information. IMERG-specific announcements will be posted to the IMERG mailing list, to which precipitation data users may subscribe (just ask through https://gpm.nasa.gov/contact). ##
Cite this page
Acknowledgement of any material taken from or knowledge gained from this page is appreciated:
Huffman, George J. &, Tan, Jackson & National Center for Atmospheric Research Staff (Eds). Last modified "The Climate Data Guide: IMERG precipitation algorithm and the Global Precipitation Measurement (GPM) Mission.” Retrieved from https://climatedataguide.ucar.edu/climate-data/gpm-global-precipitation-measurement-mission on 2026-02-27.
Citation of datasets is separate and should be done according to the data providers' instructions. If known to us, data citation instructions are given in the Data Access section, above.
Acknowledgement of the Climate Data Guide project is also appreciated:
Schneider, D. P., C. Deser, J. Fasullo, and K. E. Trenberth, 2013: Climate Data Guide Spurs Discovery and Understanding. Eos Trans. AGU, 94, 121–122, https://doi.org/10.1002/2013eo130001
Key Figures
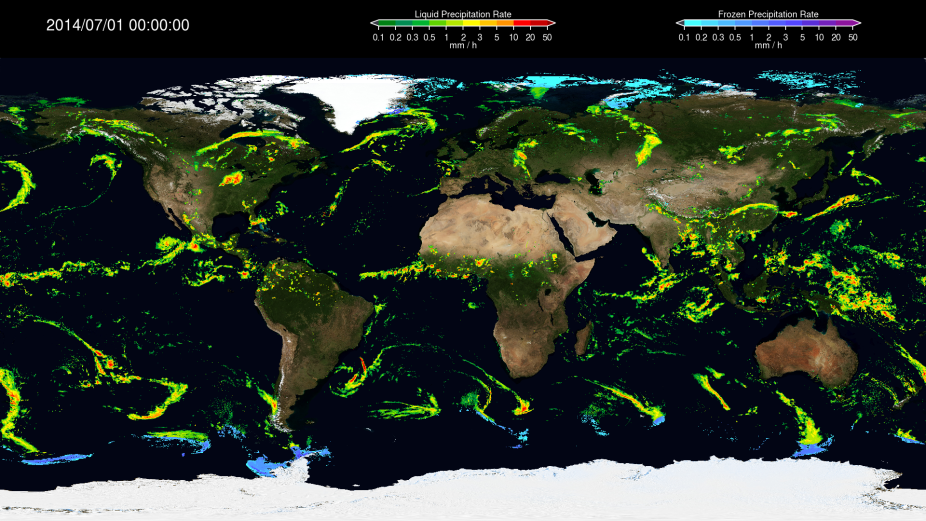
A snapshot of the global precipitation field from IMERG V07 at a particular half-hour window, showing estimates of precipitation rates—separated into rainfall and snowfall using a probabilistic phase variable available as part of IMERG— in units of mm / h at every 0.1° grid box. (contributed by Jackson Tan)
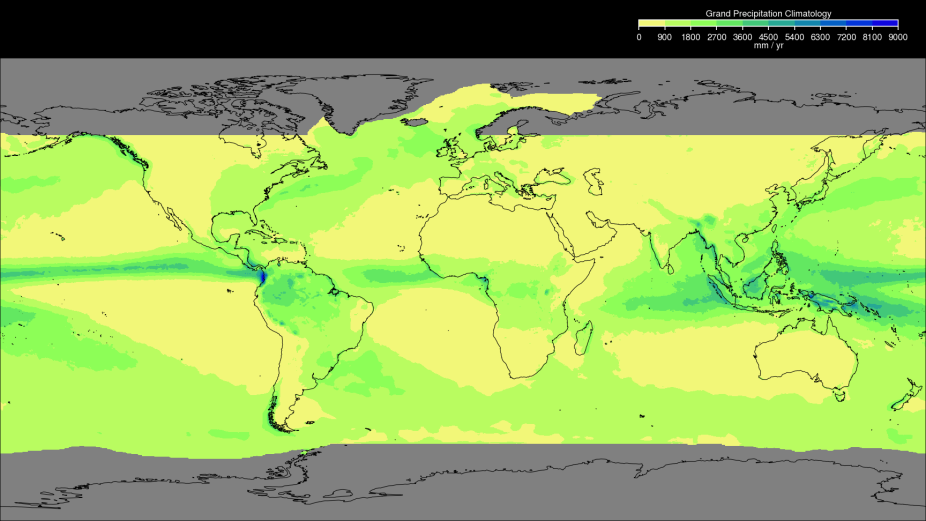
The overall climatology of global precipitation rate from IMERG V07, calculated as the mean precipitation rate in units of mm / yr from Jan 2001 to Dec 2021. (contributed by Jackson Tan)
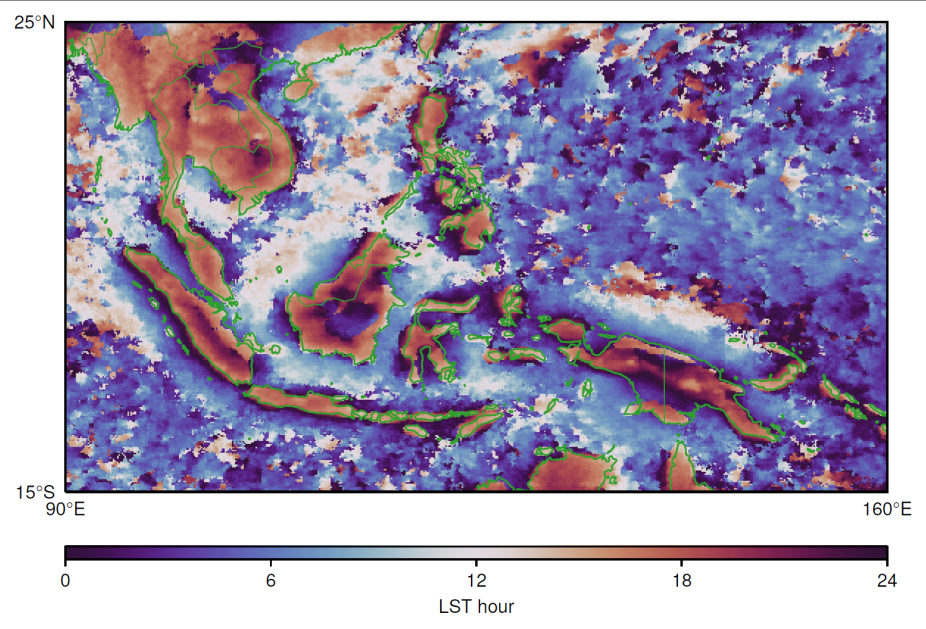
The local solar time of the peak of the diurnal cycle of the IMERG V07 precipitation rate—computed as the average precipitation rate at every half-hour of the local solar time over 2001–2019—over the Maritime Continent during March-April-May. (contributed by Jackson Tan)
Other Information
- Huffman, G. J., and Coauthors, 2020: Integrated Multi-satellite Retrievals for the Global Precipitation Measurement (GPM) Mission (IMERG). Advances in Global Change Research, 343–353, https://doi.org/10.1007/978-3-030-24568-9_19.
- Behrangi, A., G. Stephens, R.F. Adler, G.J. Huffman, B. Lambrigtsen, M. Lebsock, 2014: An Update on Oceanic Precipitation Rate and Its Zonal Distribution in Light of Advanced Observations from Space. J. Climate, 27(11), doi: 10.1175/JCLI-D-13-00679.1, 395
- Hou, A. Y., and Coauthors, 2014: The Global Precipitation Measurement (GPM) Mission. Bull. Amer. Meteor. Soc., 95, 701–722
- Liu, C., and E. J. Zipser (2015), The global distribution of largest, deepest, and most intense precipitation systems, Geophys. Res. Lett., 42
- Maggioni, V., M.R.P. Sapiano, R.F. Adler, Y. Tian, G.J. Huffman, 2014: An Error Model for Uncertainty Quantification in High-Time Resolution Precipitation Products. J. Hydrometeor., 15(3), doi:10.1175/JHM-D-13-0112.1, 1274-1292
- Sims, E. M., and G. Liu, 2015: A Parameterization of the Probability of Snow–Rain Transition. Journal of Hydrometeorology, 16, 1466–1477, https://doi.org/10.1175/jhm-d-14-0211.1.
- Wang, J.-J., R.F. Adler, G.J. Huffman, D.F. Bolvin, 2014: An Updated TRMM Composite Climatology of Tropical Rainfall and Its Validation. J. of Climate, 27(1), 273-284
- Argüeso, D., R. Romero, and V. Homar, 2020: Precipitation Features of the Maritime Continent in Parameterized and Explicit Convection Models. J. Clim., 33, 2449–2466, https://doi.org/10.1175/JCLI-D-19-0416.1.
- Boisvert, L., M. Grecu, and C. Shie, 2021: Investigating Wintertime GPM‐IMERG Precipitation in the North Atlantic. Geophys. Res. Lett., 48, https://doi.org/10.1029/2021GL095391.
- Booth, J. F., C. M. Naud, and J. Jeyaratnam, 2018: Extratropical Cyclone Precipitation Life Cycles: A Satellite-Based Analysis. Geophys. Res. Lett., https://doi.org/10.1029/2018GL078977.
- Cafaro, C., and Coauthors, 2021: Do Convection-Permitting Ensembles Lead to More Skillful Short-Range Probabilistic Rainfall Forecasts over Tropical East Africa? Weather Forecast., 36, 697–716, https://doi.org/10.1175/WAF-D-20-0172.1.
- Funk, C. C., and Coauthors, 2022: Introducing and Evaluating the Climate Hazards Center IMERG with Stations (CHIMES): Timely Station-Enhanced Integrated Multisatellite Retrievals for Global Precipitation Measurement. Bull. Am. Meteorol. Soc., 103, E429–E4
- Guilloteau, C., E. Foufoula-Georgiou, and C. D. Kummerow, 2017: Global Multiscale Evaluation of Satellite Passive Microwave Retrieval of Precipitation during the TRMM and GPM Eras: Effective Resolution and Regional Diagnostics for Future Algorithm Develop
- Huffman, G. J., 2021a: GPCP Precipitation Level 3 Monthly 0.5-Degree V3.2. https://doi.org/10.5067/MEASURES/GPCP/DATA304.
- Huffman, G. J., 2021b: GPCP Precipitation Level 3 Daily 0.5-Degree V3.2. https://doi.org/10.5067/MEASURES/GPCP/DATA305.
- Li, Z., D. B. Wright, S. H. Hartke, D. B. Kirschbaum, S. Khan, V. Maggioni, and P.-E. Kirstetter, 2023: Toward a Globally-Applicable Uncertainty Quantification Framework for Satellite Multisensor Precipitation Products Based on GPM DPR. IEEE Trans. Geosci
- Mega, T., T. Ushio, M. Takahiro, T. Kubota, M. Kachi, and R. Oki, 2019: Gauge-Adjusted Global Satellite Mapping of Precipitation. IEEE Trans. Geosci. Remote Sens., 57, 1928–1935, https://doi.org/10.1109/TGRS.2018.2870199.
- Naud, C. M., J. Jeyaratnam, J. F. Booth, M. Zhao, and A. Gettelman, 2020: Evaluation of Modeled Precipitation in Oceanic Extratropical Cyclones Using IMERG. J. Clim., 33, 95–113, https://doi.org/10.1175/JCLI-D-19-0369.1.
- Nguyen, P., M. Ombadi, S. Sorooshian, K. Hsu, A. AghaKouchak, D. Braithwaite, H. Ashouri, and A. R. Thorstensen, 2018: The PERSIANN family of global satellite precipitation data: a review and evaluation of products. Hydrol. Earth Syst. Sci., 22, 5801–5816
- Petković, V., C. D. Kummerow, D. L. Randel, J. R. Pierce, and J. K. Kodros, 2018: Improving the Quality of Heavy Precipitation Estimates from Satellite Passive Microwave Rainfall Retrievals. J. Hydrometeorol., 19, 69–85, https://doi.org/10.1175/JHM-D-17-0
- Tan, J., G. J. Huffman, D. T. Bolvin, and E. J. Nelkin, 2019: Diurnal Cycle of IMERG V06 Precipitation. Geophys. Res. Lett., 46, 13584–13592, https://doi.org/10.1029/2019GL085395.
- Tang, S., P. Gleckler, S. Xie, J. Lee, M.-S. Ahn, C. Covey, and C. Zhang, 2021: Evaluating Diurnal and Semi-Diurnal Cycle of Precipitation in CMIP6 Models Using Satellite- and Ground-Based Observations. J. Clim., 34, 3189–3210, https://doi.org/10.1175/JCL
- Tapiador, F. J., C. Marcos, J. M. Sancho, C. Santos, J. Á. Núñez, A. Navarro, C. Kummerow, and R. F. Adler, 2021: The September 2019 floods in Spain: An example of the utility of satellite data for the analysis of extreme hydrometeorological events. Atmos
- Watters, D., and A. Battaglia, 2019: The Summertime Diurnal Cycle of Precipitation Derived from IMERG. Remote Sens., 11, 1781, https://doi.org/10.3390/rs11151781.
- Wright, D. B., D. B. Kirschbaum, and S. Yatheendradas, 2017: Satellite Precipitation Characterization, Error Modeling, and Error Correction Using Censored Shifted Gamma Distributions. J. Hydrometeorol., 18, 2801–2815, https://doi.org/10.1175/JHM-D-17-0060
- Xie, P., R. Joyce, S. Wu, S.-H. Yoo, Y. Yarosh, F. Sun, and R. Lin, 2017: Reprocessed, Bias-Corrected CMORPH Global High-Resolution Precipitation Estimates from 1998. J. Hydrometeorol., 18, 1617–1641, https://doi.org/10.1175/JHM-D-16-0168.1.
- Zhang, X., and W. Xu, 2021: Diurnal Variations in Rainfall and Precipitation Asymmetry of Tropical Cyclones in the Northwest Pacific Region. J. Clim., 34, 5565–5582, https://doi.org/10.1175/JCLI-D-20-0795.1.