NSIDC Sea Ice Index
The NSIDC Sea Ice Index is a suite of easy-to-use sea ice analyses to track changes in Arctic and Antarctic sea ice. The product is produced and supported by the NOAA at NSIDC group and consists of browse imagery and data text files (CSV or Excel format). The input data is from two sources distributed by the NASA NSIDC Distributed Active Archive Center (DAAC): (1) Sea Ice Concentrations from Nimbus-7 SMMR and DMSP SSM/I-SSMIS Passive Microwave Data, Version 1 (Cavalieri et al., 1996; https://nsidc.org/data/nsidc-0051), and (2) Near-Real-Time DMSP SSMIS Polar Gridded Sea Ice Concentrations, Version 1 (Maslanik and Stroeve, 1999; https://nsidc.org/data/nsidc-0081). Both products are gridded sea ice concentration fields derived from passive microwave imagery using the NASA Team algorithm (Cavalieri et al., 1984; 1999).
The product has two primary components: (1) total sea ice extent and sea ice area values, and (3) images of sea ice concentration, extent, trends, and anomalies. Concentration is the percent coverage of ice within each grid cell. Extent is the total area covered by at least 15% concentration of ice. Area is the sum of all grid cell areas with >15% concentration weighted by the concentration of each grid cell. Essentially, extent includes the sum of all cells where some ice occurs while area is the specific amount of ice. Extent includes both open water and ice areas within the ice edge, while area only includes ice. Thus, extent is always greater than or equal to area.
[The above text was written by Dr. Walter Meier. Click the Expert Guidance tab to continue reading.]
Key Strengths
Long-term, consistent timeseries of sea ice conditions since 1979
Straightforward formats including ascii text timeseries and browse images
Uncertainties in extent have been quantified
Key Limitations
Output is constrained by limitations of source data, including: low spatial resolution, underestimation of thin and new ice, and underestimation of sea ice area during the melt season
Summary data output and imagery limits detailed spatial analysis (requires access of source concentration data)
Sea ice area estimates are not consistent in time due to changes in near-pole region not imaged by different sensors
From NSIDC:
As a condition of using these data, you must cite the use of this data set using the following citation. For more information, see our Use and Copyright Web page.
Fetterer, F., K. Knowles, W. N. Meier, M. Savoie, and A. K. Windnagel. 2017, updated daily. Sea Ice Index, Version 3. [Indicate subset used]. Boulder, Colorado USA. NSIDC: National Snow and Ice Data Center. doi: https://doi.org/10.7265/N5K072F8. [Date Accessed].
Expert Developer Guidance
The following was contributed by Dr. Walter N. Meier, National Snow and Ice Data Center, CIRES/University of Colorado at Boulder, March, 2019:
The NSIDC Sea Ice Index is a suite of easy-to-use sea ice analyses to track changes in Arctic and Antarctic sea ice. The product is produced and supported by the NOAA at NSIDC group and consists of browse imagery and data text files (CSV or Excel format). The input data is from two sources distributed by the NASA NSIDC Distributed Active Archive Center (DAAC): (1) Sea Ice Concentrations from Nimbus-7 SMMR and DMSP SSM/I-SSMIS Passive Microwave Data, Version 1 (Cavalieri et al., 1996; https://nsidc.org/data/nsidc-0051), and (2) Near-Real-Time DMSP SSMIS Polar Gridded Sea Ice Concentrations, Version 1 (Maslanik and Stroeve, 1999; https://nsidc.org/data/nsidc-0081). Both products are gridded sea ice concentration fields derived from passive microwave imagery using the NASA Team algorithm (Cavalieri et al., 1984; 1999).
The product has two primary components: (1) total sea ice extent and sea ice area values, and (3) images of sea ice concentration, extent, trends, and anomalies. Concentration is the percent coverage of ice within each grid cell. Extent is the total area covered by at least 15% concentration of ice. Area is the sum of all grid cell areas with >15% concentration weighted by the concentration of each grid cell. Essentially, extent includes the sum of all cells where some ice occurs while area is the specific amount of ice. Extent includes both open water and ice areas within the ice edge, while area only includes ice. Thus, extent is always greater than or equal to area.
Key Strengths
- Long-term, consistent time series of sea ice conditions
- Simple indicator of sea ice trends and variability since 1979
- Summarizes sea ice data in simple text files and browse images
- Easy-to-use format
- Based on high-quality, well-documented and validated sources
- Updated daily for near-real-time information
- General uncertainties are well-known and extent uncertainty has been quantified in a statistical sense
Key Limitations
- Output is constrained by limitations of source data, including: low spatial resolution, underestimation of thin and new ice, and underestimation of sea ice area during the melt season
- Summary data output and imagery limits detailed spatial analysis (requires access of source concentration data)
- Sea ice area estimates are not consistent in time due to changes in near-pole region not imaged by different sensors
- Provides a single estimate of extent and area without a quantitative uncertainty for each estimate
Discussion of Strengths and Limitations
A primary strength of the Sea Ice Index is that it distills a relatively large and complex data set of sea ice concentration fields into simple summary data and statistics, as well as providing browse images of sea ice that are more accessible to many users. This allows users to quickly compare extent and concentration fields from different time periods. Text data files (CSV or Excel format) of sea ice extent and area are provided at daily and monthly intervals. This allows easy quantitative comparison of sea ice extents from different periods. Mean climatology values and trends are also provided. Values are provided for the total in each hemisphere and, for the Arctic, regional breakdowns are given as well.
Another strength is that the processing is consistent throughout the time series. The sea ice algorithm used for the source passive microwave concentration product uses the same methodology throughout. Algorithm coefficients are adjusted for consistency across sensor transitions. This assures that even though several different sensors are used for the product, the input concentration fields are consistent. Thus, the Sea Ice Index product is also consistent.
The product is also timely and includes near-real-time data, so extent estimates are at only a 1-day lag. A near-real-time concentration field (Maslanik and Stroeve, 1999) is used as the source initially, which is later replaced by a final, better quality-controlled field (Cavalieri et al., 1996). The final field employs better calibrated source passive microwave data and includes manual quality control to remove clearly erroneous ice retrievals.
There are several limitations with the product, most of which result from the limitations of the source passive microwave concentration fields. Even with manual quality control filtering, some false ice can occur, particularly along the coast. This is due to the low spatial resolution of the passive microwave instruments (as low as ~45x70 km sensor footprints). When land and open water occur within a sensor footprint, the sea ice concentration algorithm may interpret the microwave signature to be indicative of sea ice. This results in a one or two grid cell band of false ice along the coast in some regions at certain times of the year. An automated correction is applied to filter much of this out, but some effects remain. Also, a “valid ice” mask, based on climatology, is applied for each month to remove sea ice that is clearly not possible for the given month. This again removes some, but not all of the false coastal ice.
There can also be weather effects (e.g., wind roughening of the ocean, liquid precipitation over the ocean) that result in false sea ice retrievals. Manual corrections are meant to remove these, but some may be missed in the manual process. And some are close enough to the ice edge to be ambiguous (possibly ice, but likely weather) and removal is a subjective decision of the manual correction process.
The low spatial resolution of the sensors also results in a lack of high precision near the ice edge. The edge location in the Sea Ice Index may be up to ~75 km in error in a specific location, depending on conditions.
Finally, passive microwave sensors tend to underestimate concentration in some conditions, most notably during melt, when liquid water on the surface of the ice depresses the apparent concentration. Concentration also tends to be underestimated during early ice growth (thin/new ice) when the ocean below the ice contributes to the microwave emission. This results in an underestimate of sea ice area. Sea ice extent is much less affected because it is based on a concentration threshold of 15%. Even a large bias in concentration would not affect extent as long concentration remains above 15%. These biases in theory do not affect trends and variability because they are assumed to be consistent in time. It is possible however, that with the declining trend in Arctic sea ice, there could be some bias introduced by the changes in melt timing and ice growth; again, any such effects would be much stronger in area compared to extent.
The Sea Ice Index provides consistent long-term statistics on sea ice extent and area change. However, it is not reliable for operational uses that require accuracy in ice detection at a specific location and time.
Applications
The primary research applications are for tracking of trends and variability in sea ice extent. It is used in NSIDC’s Arctic Sea Ice News and Analysis (http://nsidc.org/arcticseaicenews/), a NASA-funded project to provide daily data updates and at least monthly real-time analyses of sea ice and the Arctic environment. It has been employed in numerous publications investigating sea ice change and connections between sea ice and the atmosphere and ocean and interactions between sea ice and Arctic and mid-latitude variability and trends.
It has also been used in several climate assessments, including the AMAP Snow, Water, Ice, and Permafrost in the Arctic (SWIPA) reports (Meier et al., 2011; Barber et al., 2017) and is used in the annual NOAA Arctic Report Card (e.g., Perovich et al., 2018a) and State of the Climate Report (e.g., Perovich et al., 2018b).
It has commonly been applied climate model comparisons and validations (e.g., Stroeve et al., 2012), as well as initialization and evaluation of seasonal sea ice forecast models, including contributions to the annual Sea Ice Outlook (https://www.arcus.org/sipn/sea-ice-outlook).
Because of its simplicity, it is also used by educators to teach students about the changing Arctic. U.S. government agencies, including the Defense Department, have employed it for understanding how Arctic change affects their agencies and for strategic planning for future change. Sea Ice Index data has also been referenced by journalists in numerous stories on Arctic sea ice. There is also interest from the general public in using the simple data and clear browse imagery to illustrate change.
Common Mistakes by Users
The most common mistake by users of the Sea Ice Index is to try to assess conditions in specific locations at a specific time. As noted above, there are limitations in the product due to the low spatial resolution and other properties of the input passive microwave data. Particularly near the coast and ice edge, users need to be cautious in interpreting the ice cover. The Sea Ice Index is not meant to be an operational product and should not be used as such.
Another common mistake by users is not realizing that there are discontinuities in the total Arctic area values over the time series. This is because different sensors have different regions near the North Pole that are not imaged due to limitations in the satellite orbits, called the “pole hole”. Because there is no data there, area cannot be calculated. The size of this pole hole area has changed over time, so the amount of “possible sea ice area” changes with the pole hole size. This results in sudden jumps in area at some sensor transitions. So, Arctic area trends cannot be accurately calculated from the Sea Ice Index values. Area trends are feasible for the Antarctic because the pole hole occurs over land and doesn’t affect sea ice values.
There is not a similar problem for extent. Because the pole hole is in the immediate vicinity of the pole, it can be assumed to be ice-covered (at least 15% ice). So, the pole hole is “filled in” and the entire pole hole area is included in the extent values. Thus, changes in the size of the pole do not result in discontinuities in the extent values and Arctic extents can be compared throughout the entire time series (e.g., consistent trends and anomalies can be calculated).
Uncertainty Characterization
Uncertainties are difficult to assess because there is no high-quality, complete validation data set available. Sea ice concentration estimates from passive microwave have been assessed in numerous case study comparisons with visible/infrared or SAR data from satellites or aircraft (e.g., Cavalieri et al., 1991; Ivanova et al., 2015). Concentration errors in cold, winter conditions within the ice pack are on the order of 5%. However, under melting conditions errors can be substantially higher and, as noted above, there can be significant biases, as much as 20% or more below the actual concentration. There are also higher uncertainties near the ice edge, due to two main reasons. First, as noted above, thin ice concentration tends to be underestimated. Second, the low spatial resolution results in ambiguity of the precise location of the edge because the edge tends to be “smeared out” (mixing of ice-covered with ice-free conditions within a footprint) by the low resolution. The ice edge location uncertainties impact the Sea Ice Index estimates of both area and extent. Concentration biases have a limited impact on extent uncertainties, but do affect the area. Thus, extent is more commonly used as a climate indicator.
There are two aspects of uncertainty relevant for the Sea Ice Index, absolute and relative uncertainty. Absolute uncertainty assesses the difference between the Sea Ice Index values and the “true” extent. As noted above, there isn’t a valid source for “true” extent. However, it is possible to get some sense of an absolute error by comparing the Sea Ice Index with other sea ice extent products. A comparison of several products yielded a range in extent up to 500,000 to 1,000,000 square kilometers between products (Meier and Stewart, 2019; Ivanova et al., 2014). Some of these differences are due to differences in sensor/product spatial resolution, land masks and other ancillary data as well as quality-control measures. However, much of the difference is due to the specifics of the algorithms in how sensitive they are to detecting ice under various conditions. While the difference seems considerable, it amounts to roughly a 1-2 grid cell (25-50 km) bias in the ice edge location between the products. Because the differences between products at a given time of year are consistent from year-to-year, their trends and variability are more consistent.
Regarding trends and variability, for a given product such as the Sea Ice Index, the key issue is relative uncertainty – how stable are the estimates over time. This is even more challenging to assess. An approach used for the Sea Ice Index, was to run an ensemble of the algorithm while changing the input data (using different versions of the same sensor) and adjusting algorithm parameters (Meier and Stewart 2019), and using the variability (standard deviation) as an indicator of uncertainty. This yield an average daily extent uncertainty (2 standard deviation range) of 60,000 square kilometers in the Arctic and 72,000 square kilometers in the Antarctic. Higher uncertainties were found during summer when there is substantial melt, as well as more atmospheric influence. The uncertainties in annual maximum and minimum extents were ~35,000-40,000 square kilometers, with a slightly higher uncertainty (56,000 square kilometers) for the Antarctic maximum.##
Cite this page
Acknowledgement of any material taken from or knowledge gained from this page is appreciated:
Meier, Walter & National Center for Atmospheric Research Staff (Eds). Last modified "The Climate Data Guide: NSIDC Sea Ice Index.” Retrieved from https://climatedataguide.ucar.edu/climate-data/nsidc-sea-ice-index on 2026-06-21.
Citation of datasets is separate and should be done according to the data providers' instructions. If known to us, data citation instructions are given in the Data Access section, above.
Acknowledgement of the Climate Data Guide project is also appreciated:
Schneider, D. P., C. Deser, J. Fasullo, and K. E. Trenberth, 2013: Climate Data Guide Spurs Discovery and Understanding. Eos Trans. AGU, 94, 121–122, https://doi.org/10.1002/2013eo130001
Key Figures

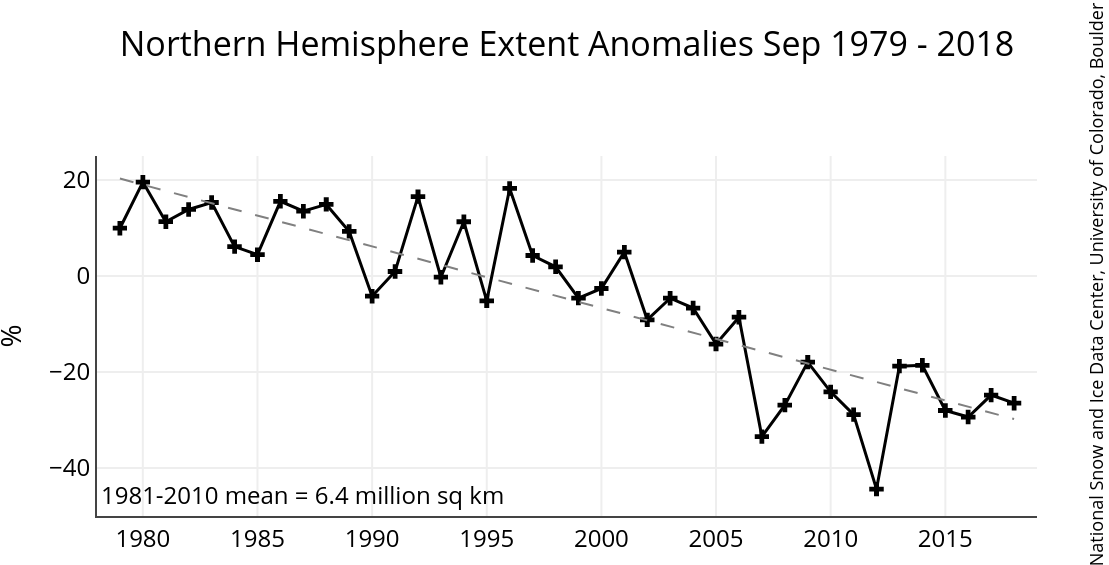
Figure 1. Northern Hemisphere extent percent anomalies for September 1979-2018. Trend and trend standard deviation values are relative the 1981-2010 average. (contributed by W Meier)
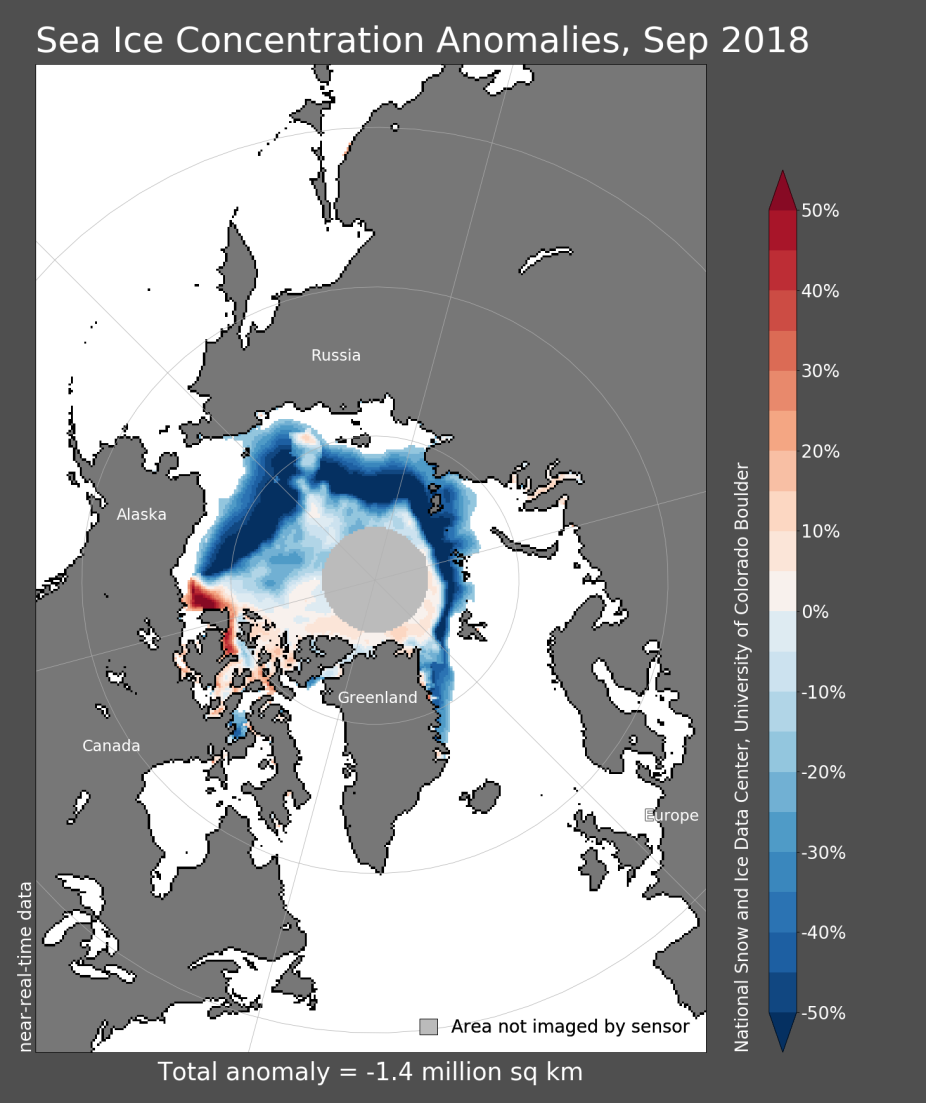
Figure 2. Northern Hemisphere concentration anomalies for September 2018 relative to the 1981-2010 average. (contributed by W Meier)