APHRODITE: Asian Precipitation - Highly-Resolved Observational Data Integration Towards Evaluation of Water Resources
APHRODITE’s (Asian Precipitation - Highly-Resolved Observational Data Integration Towards Evaluation) gridded precipitation is a set of long-term (1951 onward) continental-scale daily products that is based on a dense network of rain-gauge data for Asia including the Himalayas, South and Southeast Asia and mountainous areas in the Middle East. The gridded products are available for four sub-domains--Monsoon Asia, Middle East, Russia, and Japan--as well as a combined domain. The time-varying data have a 0.25x0.25 or 0.5x0.5 degree horizontal resolution in each domain, except for Japan, which has a 0.05x0.05 degree horizontal resolution. Climatological daily mean precipitation and temperature data are available for Monsoon Asia at 0.05x0.05 degree resolution.
While the high density of input stations, interpolation scheme, and quality control of data generally allow for the study of detailed precipitation climatology as well as extreme events, users of APHRODITE gridded products should be aware that the amount of input data varies in space and time, and the input data are not homogenized. Trend analyses and the characterization of extreme events should be done with caution.
The target time period, horizontal resolution (0.25 degree and 0.5 degree), additional parameters and information, and therefore strengths/limitations are different at the various versions of the products. A full list of the products is shown in the figures on this page, and on the APHRODITE website.
During the first phase of the APHRODITE project (Asian Precipitation – Highly Resolved Observational Data Integration Towards Evaluation of water resources (APHRODITE’s water resources), 2006-2011), several versions of daily gridded precipitation data were released, and the algorithm of version 1101 (V1101) is described in Yatagai et al (2012). The V1101 products cover Monsoon Asia (APHRO_MA_V1101), northern Eurasia (APHRO_RU_V1101) and Middle East for 1951-2007. Products over Japan (APHRO_JP, Kamiguchi et al., 2010) were also released, covering a longer time period with higher spatial resolution (0.05 deg/0.05deg).
The target of APHRODITE-2 (2016-2019) was representing extreme events. Version 1801R1 and 1901 covers over only Monsoon Asia and is updated thru 2015. Please read the “expert guidance” to know the algorithm difference between these products with that of V1101. The daily grid precipitation climatology (0.05 degree/0.05 degree resolution) that was used to make V1901 has also been released. During APHRODITE-2, APHRO_JP was updated, and hourly precipitation and two kinds of end-of-the-day (EOD) daily precipitation (which means 24-hour accumulation at Japanese local time (15UTC—15UTC) and universal time (00UTC -- 24UTC)) were released.
As for temperature, during the first phase, AphroTemp (V1204R1) covers Monsoon Asia for 1961-2007 and rain/snow discrimination information is attached to V1101 (which is V1101R2). The reference for these products is Yasutomi et al. (2011). Recently, updated versions of temperature data (APHRO_MA_V1808 daily mean Temperature, 1961-2015) and daily climatology (0.05/0.05 degree) were released. Details are described in the expert guidance and on the APHRODITE product page.
Key Strengths
Inputs a dense network of rain-gauge data across Asia
Long-term dataset (1951-near present for precipitation, 1961-near present for temperature) with daily resolution
Metadata includes information about the number and proximity of rain-gauges used in the analyses each day
Key Limitations
The quality of the gridded data is highly dependent on the amount of input data, which varies in space and time. Users should check the station density (availability of rain-gauges within the target domain).
24-hour accumulation time (End of the day, EOD) is different from source to source. The treatment of EOD is different from V1101, V1801R1 and V1901. Users should read the 'Expert Guidance' section of this page
The precipitation and temperature data are not homogenized (no corrections for station location, gauge type, and other factors)
Yatagai, A., K. Kamiguchi, O. Arakawa, A. Hamada, N. Yasutomi, and A. Kitoh, 2012: APHRODITE: Constructing a Long-Term Daily Gridded Precipitation Dataset for Asia Based on a Dense Network of Rain Gauges. Bulletin of the American Meteorological Society, 93, 1401–1415, https://doi.org/10.1175/bams-d-11-00122.1.
users must register
Expert Developer Guidance
- Inputs a dense network of rain-gauge data across Asia, especially around the Himalayas
- Long-term dataset (1951-near present for precipitation, 1961-near present for temperature) with daily resolution
- High temporal (daily)and spatial resolution (.25x.25 over Asia; .05x.05 over Japan) for continental/regional scale analyses
- Comprehensive interpolation methodology to account for orographic effects
- Well-developed quality control of station data
- Metadata includes information about the number and proximity of rain-gauges used in the analyses each day
Key Limitations
- The quality of the gridded data is highly dependent on the amount of input data, which varies in space and time. Users should check the station density (availability of rain-gauges within the target domain).
- Reliability of trend analyses is limited by the station data density, which varies in time
- 24-hour accumulation time (End of the day, EOD) is different from source to source. The treatment of EOD is different from V1101, V1801R1 and V1901. Users should read the 'Expert Guidance' section of this page.
- Users should register (login) at APHRODITE’s web-site (http://aphrodite.st.hirosaki-u.ac.jp).
- Many of the underlying station data are subject to usage restrictions and are not available to the end users of the gridded APHRODITE products
- The precipitation and temperature data are not homogenized (no corrections for station location, gauge type, and other factors)
Expert Guidance
1. Introduction
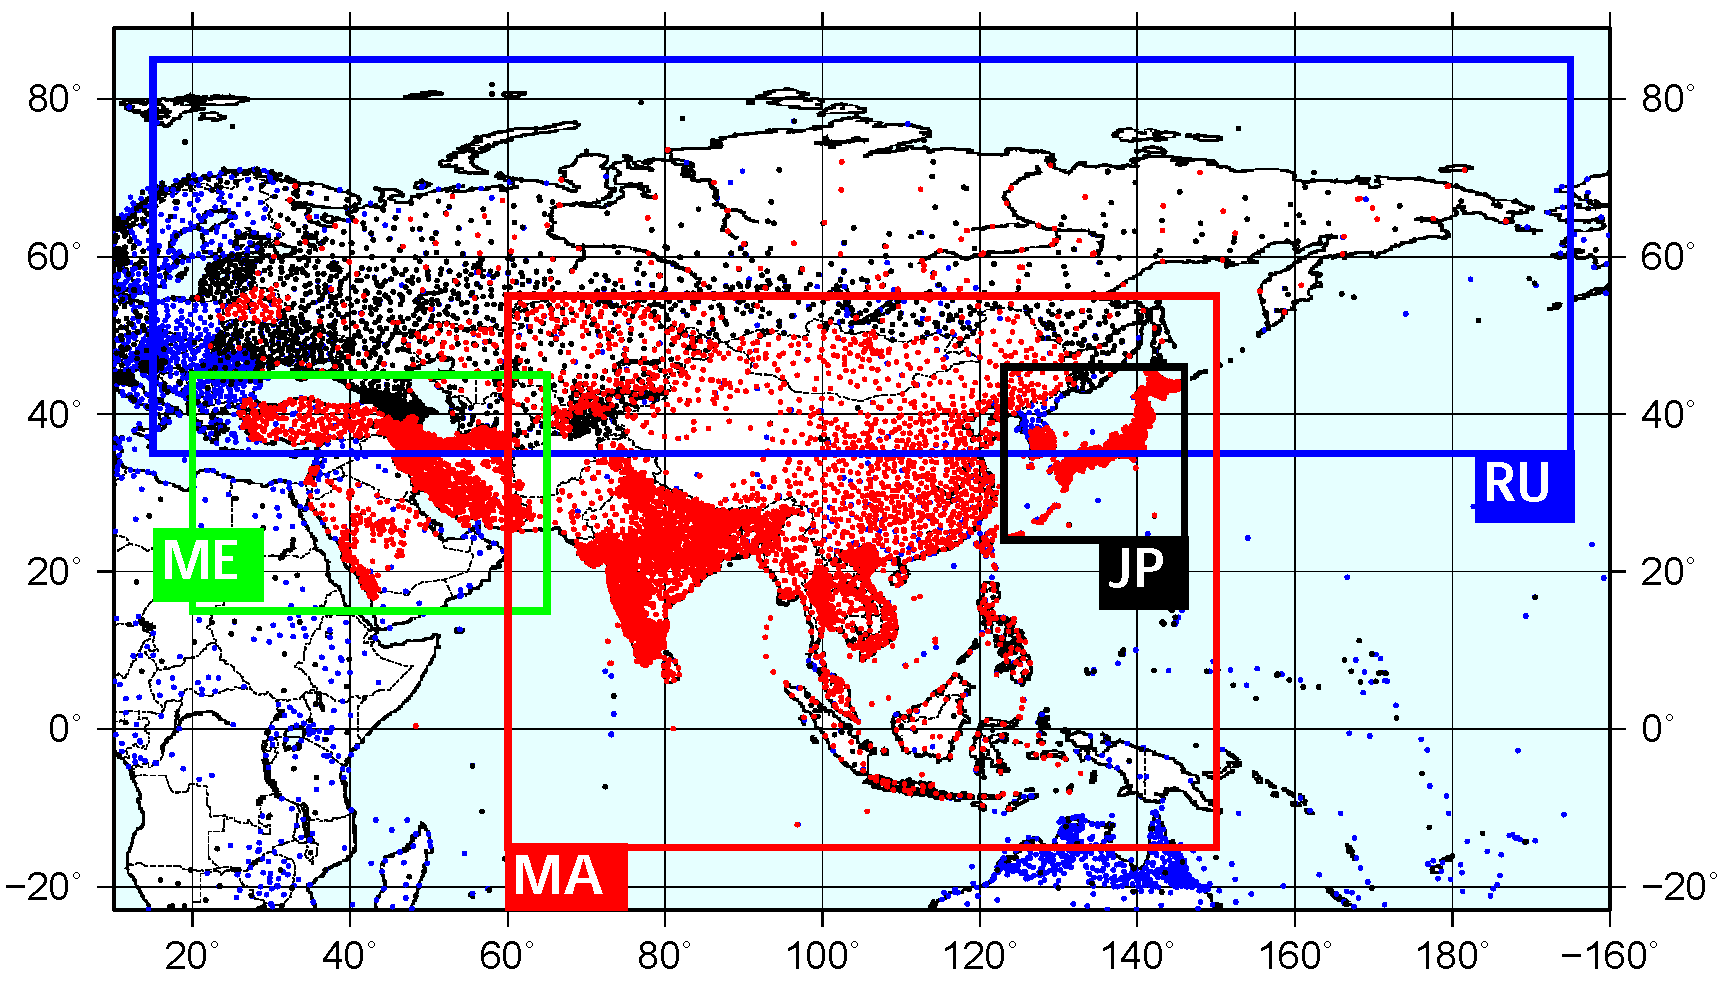
The first product was developed by Dr. Akiyo Yatagai in collaboration with Dr. Pingping Xie and Dr. Pinhas Alpert for the Middle East (Yatagai et al., 2008). During phase-1 of APHRODITE (Asian Precipitation - Highly-Resolved Observational Data Integration Towards Evaluation of Water Resources, APHRODITE-1) operated by Research Institute for Humanity and Nature (RIHN) and Japan Meteorological Agency (JMA), a suite of precipitation products has been constructed by the APHRODITE team during the five years (2006-2011). The algorithm was constructed for evaluating water resources, so we collected as many input data as possible for our analysis (Figure 1). The algorithms of the final products of the APHRODITE-1 were described in refereed articles (Kamiguchi et al., 2010; Yasutomi et al., 2011; Yatagai et al., 2012).
After a five-year gap in the project, we were able to restart APHRODITE to represent “extreme events” in collaboration with Hirosaki University, Kyoto University and Chiba University. The APHRODITE for Extreme Events (APHRODITE-2) was funded during June 2016 to March 2019. Since the role of global warming on extreme events has been gaining more attention, we refined the APHRODITE algorithm for better representation of extreme events. In response to many international requests for updating APHRODITE, we developed long-term daily gridded precipitation and temperature datasets from station observation records over Asia by international collaborations with local meteorological/hydrological agencies and researchers. With limited time and resources, we concentrated on Monsoon Asia and Japan during APHRODITE-2.
Most of this expert guidance explains the difference between the products of APHODITE-2 and APHRODITE-1. We summarize currently available products in Section 2. The algorithm to make APHRODITE-2 precipitation and difference from the previous products (APHRODITE-1) are described in Section 3. The same for APHODITE temperature is described in Section 4. Finally, we describe what we are going to do in the current phase (APHRODITE-3) in Section 5.
2. APHRODITE Datasets
Table 1 shows a list of APHRODITE datasets that are released at the APHRODITE web site (http://aphrodite.st.hirosaki-u.ac.jp). V1101 daily precipitation (Yatagai et al., 2012) and V1207 daily precipitation over Japan (updates from Kamiguchi et al., 2010) are the products from APHRODITE-1. APHRODITE temperature data from APHRODITE-1 (V1204R1, Yasutomi et al., 2011) were superseded and updated by new version data V1808 listed in the table. Generally, we put the version name when we freeze the algorithm (i.e. V1101 means the algorithm was frozen in January 2011). If a serious error is found after releasing a product, we quickly make a revised version. In such case, we put “R1” after the version name.
We create APHRODITE products in collaboration with many researchers and cooperative institutions. Using a large number of input data that are not available from publicly available data (such as Global Summary of Day, by NOAA, shown in blue dots in Fig. 1) is one of the biggest advantages of APHRODITE products. In most cases, such off-line data (shown in red dots in Fig.1) that APHRODITE (and/or Dr. Yatagai) obtained by project/personal connection have restrictions that we cannot pass the original data to a third party. Therefore, we cannot publish the original station data nor the 0.05 degree daily grid precipitation/temperature data, although we interpolate them on 0.05 degree grid interval. This is the reason that we release our data in 0.25 degree and 0.50 degree except for Japan. However, for the data providers, we pass the original 0.05 degree daily grid precipitation analysis over the country as a feedback (details are written at our FAQ http://aphrodite.st.hirosaki-u.ac.jp/faq_en.html) .
3. Algorithm and Improvements of precipitation products
3.1) Algorithm
Figure 3 depicts the algorithm flow of producing APHRODITE precipitation data. We create 0.05 degree climatology in Task3, and with this climatology we take daily ratio to the climatology of the relevant grid cell. Interpolation itself is an inverse-distance weighting which is similar to Shepard (1968) and Willmott et al. (1985), however we take into consideration of a ridge between the target grid and each observation. Details are written in Yatagai et al. (2012). The critical issues to create better products are (i) collect (use) as many rain-gauge observations as possible and (ii) improve climatology. So, continuous efforts of collecting rain-gauges have been maintained. For the end of APHRODITE-2 production (January 2019), the collection of offline precipitation data (year and country) is shown in Figure 2. We made V1101EX_R1 for 2007 – 2015 with the same algorithm of V1101, however, number of input data are different at the same year (2007) of both products.
The green colored squares show the steps we added and/or modified during APHRODITE-2, namely, these changes have been applied to the products V1801R1 and V1901 from V1101. Details will be explained at next section. We released pink-colored products (0.05 degree daily climatology, 0.25/0.5 degree daily analysis) for Monsoon Asia. The blue-colored 0.05 degree daily precipitation data is only released for the Japan analysis.
3.2) Difference from the previous products
It is a trade-off to use as many data as possible or to use consistent data. By adopting the “ratio” interpolation scheme, seasonal precipitation amount can be adjusted even in data-sparse areas or years by the aid of using “climatology”, however, extreme events and their long-term trends cannot be adjusted by such a scheme (Kamiguchi et al., 2010). For APHODITE-1, our policy was to use as many data as possible, and to use the same scheme throughout the time period and regions. We used all GSOD data for which a flag indicates 24-hr accumulation in spite of unknown accumulation time (which is end of the day time). GTS-based GSOD data sometimes includes erroneous “0 mm” precipitation in spite of no observation (missing) at the day, which results in significant underestimate of precipitation.
On the contrary, for APHRODITE-2, we carefully decide whether to use GSOD data or not. At first, if we have enough other data from a country for a year, we did not use GSOD for the country and at the year. As shown in Fig. 2, if there are offline data, we did not use GSOD. In addition, we checked end of the day of each obtained data (both GSOD and offline data). Hence, the number of data we input are different in the products (V1101, V1801R1 and V1901.
After checking “end of the day” (EOD) information of each input file, we do not mix different EOD dataset at a country/year for V1801R1. While, based on EOD information and using satellite estimate precipitation, we adjusted precipitation value to the universal 24-hr (00UTC – 24 UTC) period of time, which means EOD=24 for V1901 product.
The purpose of APHRODITE-2 was to evaluate extreme events and to contribute meteorological analyses including improving forecasts. To achieve this goal, we have improved our algorithm for the three points;
i) improving quality control,
ii) Careful treatment of “end of the day (EOD)” difference, and
iii) Modifying the interpolation algorithm to represent extreme values and station value conservation (SVC)
We explain these points as follows.
3.3) Quality Control (QC)
We are using an automatic quality control program (Hamada et al., 2011), which flags suspicious values. If a large value exceeds "country record" of the country, the data is automatically rejected. However, there is sometimes record-breaking heavy rainfall, and sometimes the "country record" information of the historical maximum is not available. In order to distinguish the real extremes with errors, we compared the large amount values with satellite estimates. For V1801R1 and V1901, we used two satellite daily precipitation products (CMORPH, TRM3B42) to check large precipitation values and isolated extreme values, and to judge whether they are really extreme or not. Then, we rescued real extremes to the white list and discarded false extremes in the blacklist.
3.4) End of the Day (EOD)
In some countries, precipitation is observed hourly or every 10 minutes, and in other countries, precipitation is measured in the morning or at a regulated time manually. For example, in India, "daily precipitation" is observed in the morning (8:30 local time, LT), and stamped on that day. 8:30LT corresponds to 03 UTC (universal time). Hence, if station data shows 10 mm/day on August 31st, then, 10 mm rainfall is observed from 03 UTC of August 30th to 03 UTC of August 31st. We call this record as "EOD = 03 UTC". In V1101 and V1801 products, daily grid precipitation data over India ends at 03 UTC of recorded time.
In Japan, the AMeDAS network is based on automatic measurements at 10-minute intervals, and we can accumulate hourly and/or daily values at any interval from the 10-minute observations. In APHRO_JP, we made gridded precipitation according to Japan standard time (JST), which is from 15 UTC of previous day to 15 UTC of the stamped date. In this case, EOD=15. Further, Japan Meteorological Agency (JMA) sends either 6-hrly, 12-hrly or 24-hrly precipitation to GTS network according to the WMO's regulation. (e.g. Synoptic stations (relatively big stations) must send previous 24-hr rainfall at 00 UTC). This leads to different EOD data archived at GSOD database, although it contains flags of their processing. We use only AMeDAS for APHRO_JP, but we used both AMeDAS and GTS based data for APHRO_MA_V1101. While in V1801R1, we checked EOD of each data file and we carefully select data to use. We decide not to use different EOD data in a domain for V1801R1. So, the number of data we used in V1801R1 is sometimes less than that of V1101. The detailed procedure to estimate EOD using a satellite (CMORPH) hourly precipitation product is described at Yatagai et al. (2020, revised, to Atmosphere.)
3.5) Station Value Conservation (SVC)
When we interpolate station values (or the ratio of the station value to climatology), we take several to several decades worth of station data around the target grid into consideration. Hence, if extremely heavy and localized precipitation occurs at or very near to the grid box, using many surrounding station data may cause underestimate/overestimate of the target grid-box precipitation. In V1801, after interpolation of ratio to climatology and after getting grid precipitation values by multiplying ratio to climatology, we put the original station value to the 0.05 degree grid box, if the grid box has a station. That means, the station value is conserved (SVC) at each 0.05 grid box. If there are two or more stations in a grid box, we average them and put the averaged value into the grid box. In the same manner, if the grid box has no rainfall, but if surrounding stations have rainfall, V1101 showed some precipitation. But V1801 and V1901 conserve the station value at 0.05 degree (intermediate) file, we can get statistics of "0 mm" at the grid box. For the publicly released data, we regrid 0.05 grid to 0.25/0.5 degree, and the station value is not conserved (see Figures 1 and 2 of V1801R1 readme, http://aphrodite.st.hirosaki-u.ac.jp/product_readme/V1801R1_readme.pdf).
3.6) New climatology
The APHRODITE product is calculated by ratio (station value/grid climatology) interpolation. Climatology of previous products are based on monthly analysis (Yatagai et al., 2012). Now that our project has collected dense observation data, new daily climatology is developed from the APHRODITE daily precipitation product.
First, 30-year (1981-2010) daily precipitation product is calculated using previous climatology (WorldClim + Monthly station observation), without SVC. EOD adjustment is not applied, but an unmixed EOD source is used for each country. The 21-day running mean of daily average for 30 years is defined as new climatology. Data onFebruary 29th of non-leap year is prepared by the average of February 28th and March 1st and the 30-year average is carried out for that day.
We released this climatology in V1901.
3.7) Rain-gauge availability information (RSTN)
It is very important to know whether each grid-box value is just interpolation or reflects an observed value within the grid box or nearby. Hence, we put “number of observations” information for each day on each grid at 0.05 degree product such as APHRO_JP and the feedback versions given to data providers. When we apply regridding at Task 5 (see, Fig.3), we count the grids with at least one rain-gauge observation. When we create the 0.25 (0.50) degree products, each grid box has 25 (100) grids of 0.05 degree. If there is one grid with 25 grids, we count “ration of station grids (RSTN)”, and put this information with the product day by day. For 0.25 degree gridded products, RSTN=4(%) means there is one grid with a station, and RSTN=8(%) means there are two grids with a station.
Hence, users must check the value of RSTN, and use only grids where RSTN is not 0.0, especially when APHRODITE ais used as a reference to validate satellite estimates and/or model simulate precipitation. If they want to evaluate trends and/or long-term change of precipitation amount, they must check the time series of RSTN in their target area.
We are frequently asked “Can we use APHRODITE for studying extreme events?”. The answer is, it depends on your purpose. Although we applied SVC for V1801R1 and V1901 so that the APHRODITE team can evaluate changes of extreme value with 0.05 degree products, \ we only release regridded (0.25/0.5) products so that general users cannot discuss the precise change based on the value which has the same accuracy with the station values after quality control. In any case, the user must check the change of RSTN. Please also check our FAQ page (http://aphrodite.st.hirosaki-u.ac.jp/faq_en.html).
As for V1901, we adjusted EOD before interpolation. At some areas where the EOD of original data are either 0 or 24, we have no change at each value, however, the case of original data EOD is not 0 or 24, users cannot treat our gridded value as equivalent to observed precipitation.
4. Algorithm and Improvements of temperature products
AphroTemp_V1808 is a daily mean temperature product at 0.50 and 0.25 degrees. More data is collected and analyzed than AphroTemp_V1204R1 and the data period is also extended to 2015. A topographical effect scheme is introduced to interpolation algorithm.
Surface observations in India, Bhutan, Thailand, Myanmar are added to the grid analysis after AphroTemp_V1204R1. Due to the increased number of observations of and improvement of interpolation algorithm, climatology and estimated values in South Asia are well represented in the new product.
4.1) Algorithm and important information on RSTN
For temperature, the products we release are 0.5x0.5-degree and 0.25x0.25-degree gridded daily mean temperature data over Monsoon Asia (APHRO_TAVE_MA_V1808).
The gridded fields of daily mean temperature are defined by interpolating gauge observations obtained from meteorological stations throughout the region. The algorithm for the new product is made with a few modifications on the precipitation algorithm V1101 (Yatagai et al., 2012). Figure 4 shows the flowchart for the temperature algorithm. Instead of ratio interpolation as for precipitation, we interpolate anomalies at the target grid. We interpolate the subtraction of the daily mean temperature from the climatology at a resolution of 0.05 degrees, then add each gridded anomaly to each gridded climatology value day-by-day. We then re-gridded the 0.05-degree analysis to both 0.5-degree and 0.25-degree grids. Details are given in Yasutomi et al. (2011).
An indicator is introduced to represent the reliability of the interpolated daily temperature fields. This indicator, named RSTN, is also calculated for each re-gridded 0.50-degree (0.25-degree) cell as the proportion of 0.05-degree cell(s) containing station(s). The number of input data differs from year to year. Users interested in long-term changes should consider this indicator.
4.2) Points of concern
i) Lack of observation data (in Indonesia and Papua New Guinea)
Daily observations over Indonesia and Papua New Guinea are sparse. A considerable number of temperature grids over New Guinea Island are missing until the 1980's. The distribution of valid station observations is provided (RSTN) for each day. Users should pay attention to the density of observations.
ii) Homogenization of observations
We do not homogenize the observed time series of temperature data. Changes in gauges, location of the stations, and many other factors might cause discontinuity of observational data.
iii) Improvement in calculation after Yasutomi et al.(2011)
The anomaly interpolation method is introduced in Yasutomi et al. (2011). The climatological mean temperature is based on AphroClim_V1808. First, we derive the difference from climatology, next, anomalies are interpolated into 0.05 degree grid. Then anomalies are added to the climatology and regridded into 0.25 degree and 0.50 degree grid. We released the 0.05 degree climatology.
5. Current Developments (APHRODITE-3) and Future Plans
The APHRODITE team at Hirosaki University (led by Prof. Yatagai) received support from the university for 2019-2022 to continue APHRODITE activity and improve its algorithm for cold regions. As a part of APHRODITE-3 activity, we had a workshop by inviting more than 20 researchers from Russia, the Central Asia and United States. Based on the data we obtained recently, we will make update versions of APHRO_RU and APHRO_ME.
However, for EOD adjustment, satellite precipitation estimates over high latitudes/altitudes are challenging, especially for the snow-covered land surface. We also try to use meteorological reanalysis products to compensate for the problem. As a university located in northern Japan, where we have plenty of snow in winter, we are applying some adjustment method to get quantitative solid precipitation. A test product to apply wind-induced undercatch (Masuda et al., 2019) is also released at our web-site.
There are many trade-offs between keeping original values to reserve extreme values and adjusting original data to quantified value. As shown in Table 1, we already have various versions of the products. We are planning to make a tool for subsetting and downloading the data that users choose. In order to contact every user when the APHRODITE team makes updates or discovers errors, we ask every user to register at our site. Users are also strongly requested to pay attention to the distribution and change of the parameter RSTN. ##
Cite this page
Acknowledgement of any material taken from or knowledge gained from this page is appreciated:
Maeda, Mio &, Yasutomi, Natsuko &, Yatagai, Akiyo & National Center for Atmospheric Research Staff (Eds). Last modified "The Climate Data Guide: APHRODITE: Asian Precipitation - Highly-Resolved Observational Data Integration Towards Evaluation of Water Resources.” Retrieved from https://climatedataguide.ucar.edu/climate-data/aphrodite-asian-precipitation-highly-resolved-observational-data-integration-towards on 2026-02-17.
Citation of datasets is separate and should be done according to the data providers' instructions. If known to us, data citation instructions are given in the Data Access section, above.
Acknowledgement of the Climate Data Guide project is also appreciated:
Schneider, D. P., C. Deser, J. Fasullo, and K. E. Trenberth, 2013: Climate Data Guide Spurs Discovery and Understanding. Eos Trans. AGU, 94, 121–122, https://doi.org/10.1002/2013eo130001
Key Figures
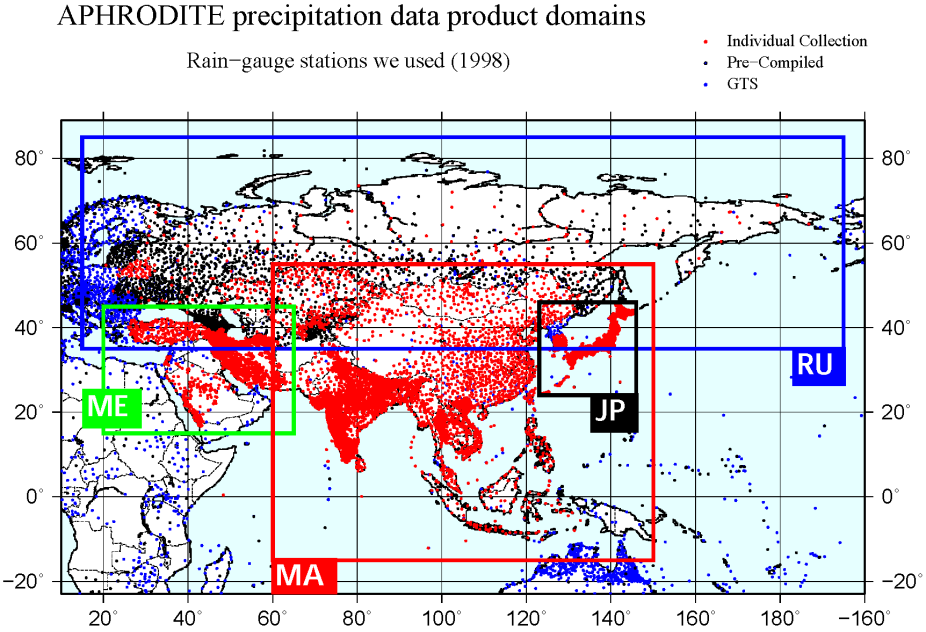
Figure 1. An example of station data distribution that were used in our analysis. Red: individual collection, Black: pre-compiled data (more than one country) and Blue: global telecommunication network (GTS) based data that we obtained from Global Summary of Day (NCEI/NOAA). The rectangles show the domain of our old products (V1101). (Contributed by A. Yatagai)
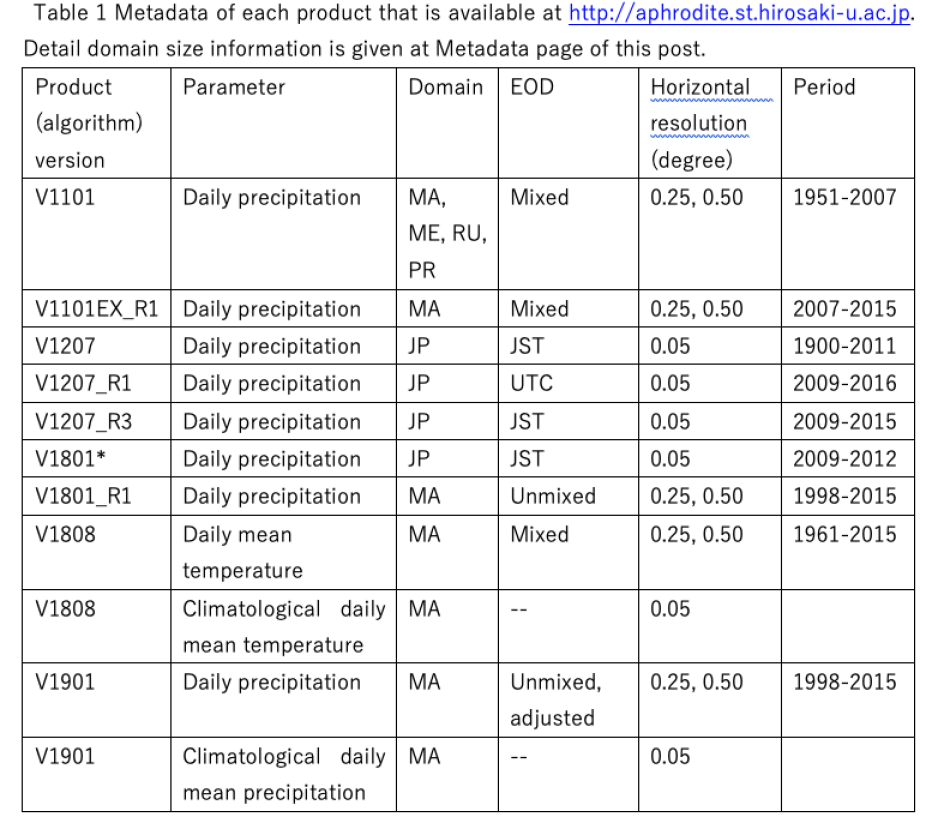
Table 1. Metadata of each product that is available at http://aphrodite.st.hirosaki-u.ac.jp. (Contributed by M. Maeda)
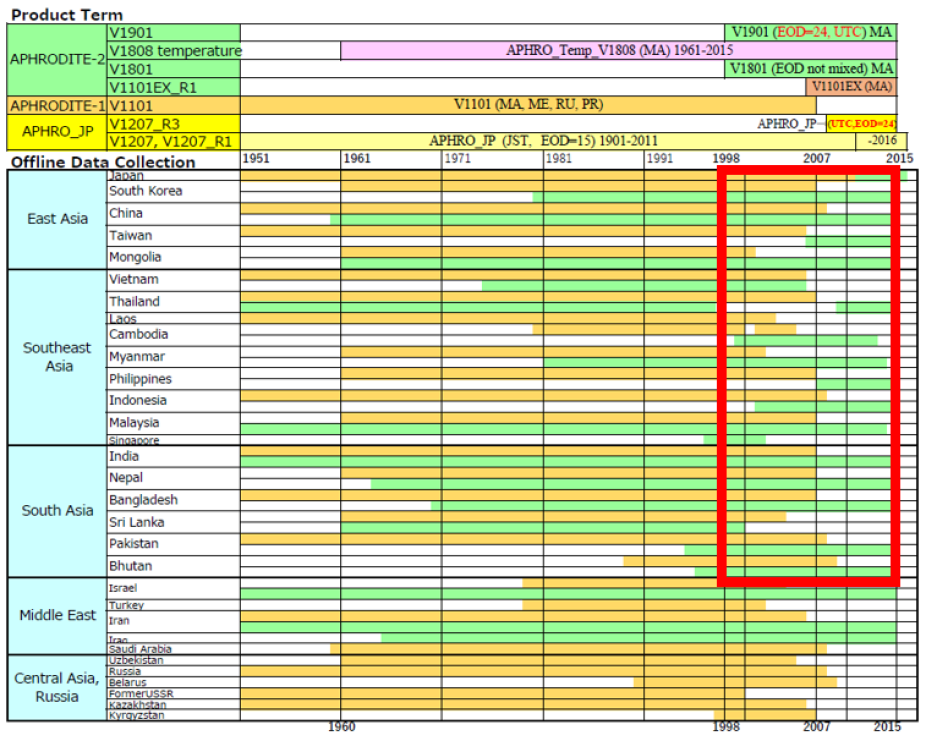
Figure 2. Period of APHRODITE products and availability of off-line data (precipitation). Yellow/green bars in the offline data collection indicate the data obtained by APHRODITE-1/APHRODITE-2 project term. V1101 products do not include data shown with green bars. A red open square designates APHRODITE-2 precipitation products (V1801R1 and V1901). APHRODITE temperature product (V1801) is shown with a pink bar. (Contributed by M. Maeda)
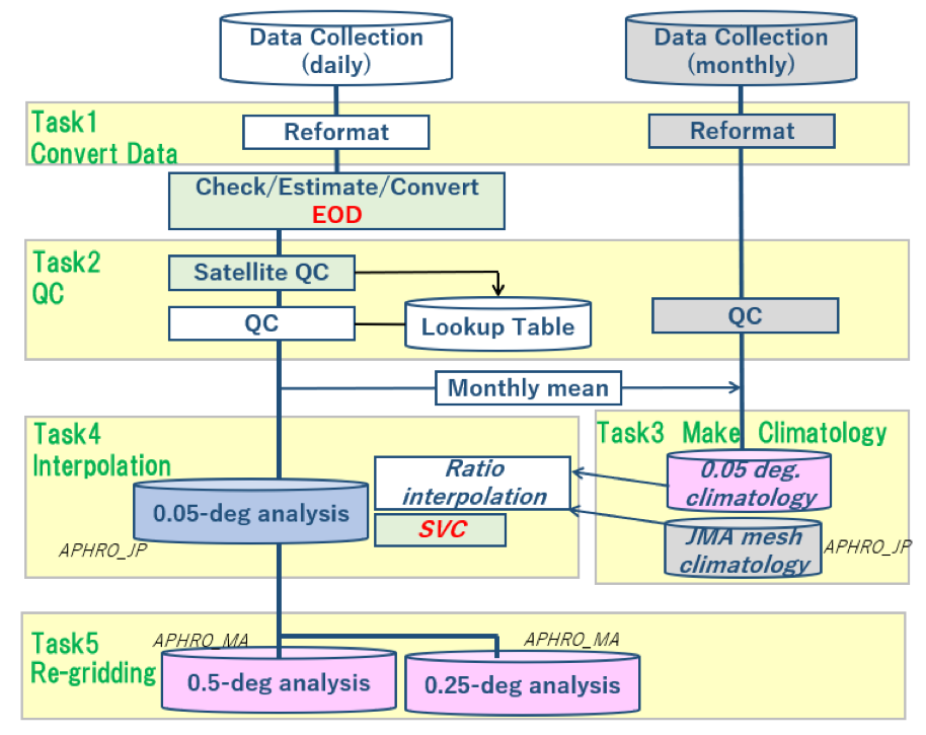
Figure 3. Flow chart of creating APHRODITE gridded precipitation data. Italic shows options. (Contributed by A. Yatagai)
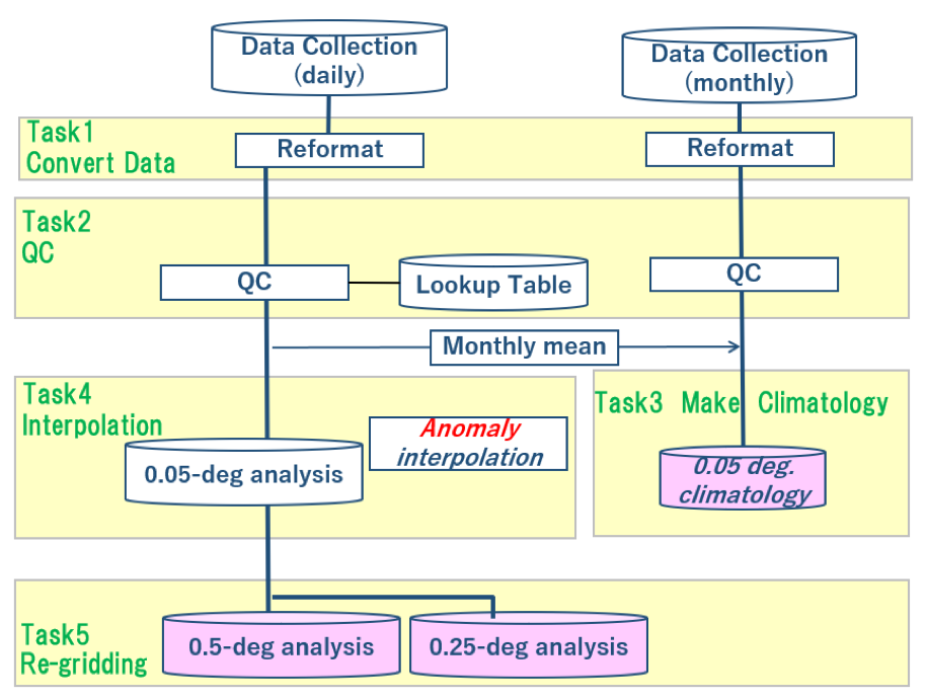
Figure 4. Algorithm flow of creating APHRODITE temperature grid data. (Contributed by A. Yatagai)
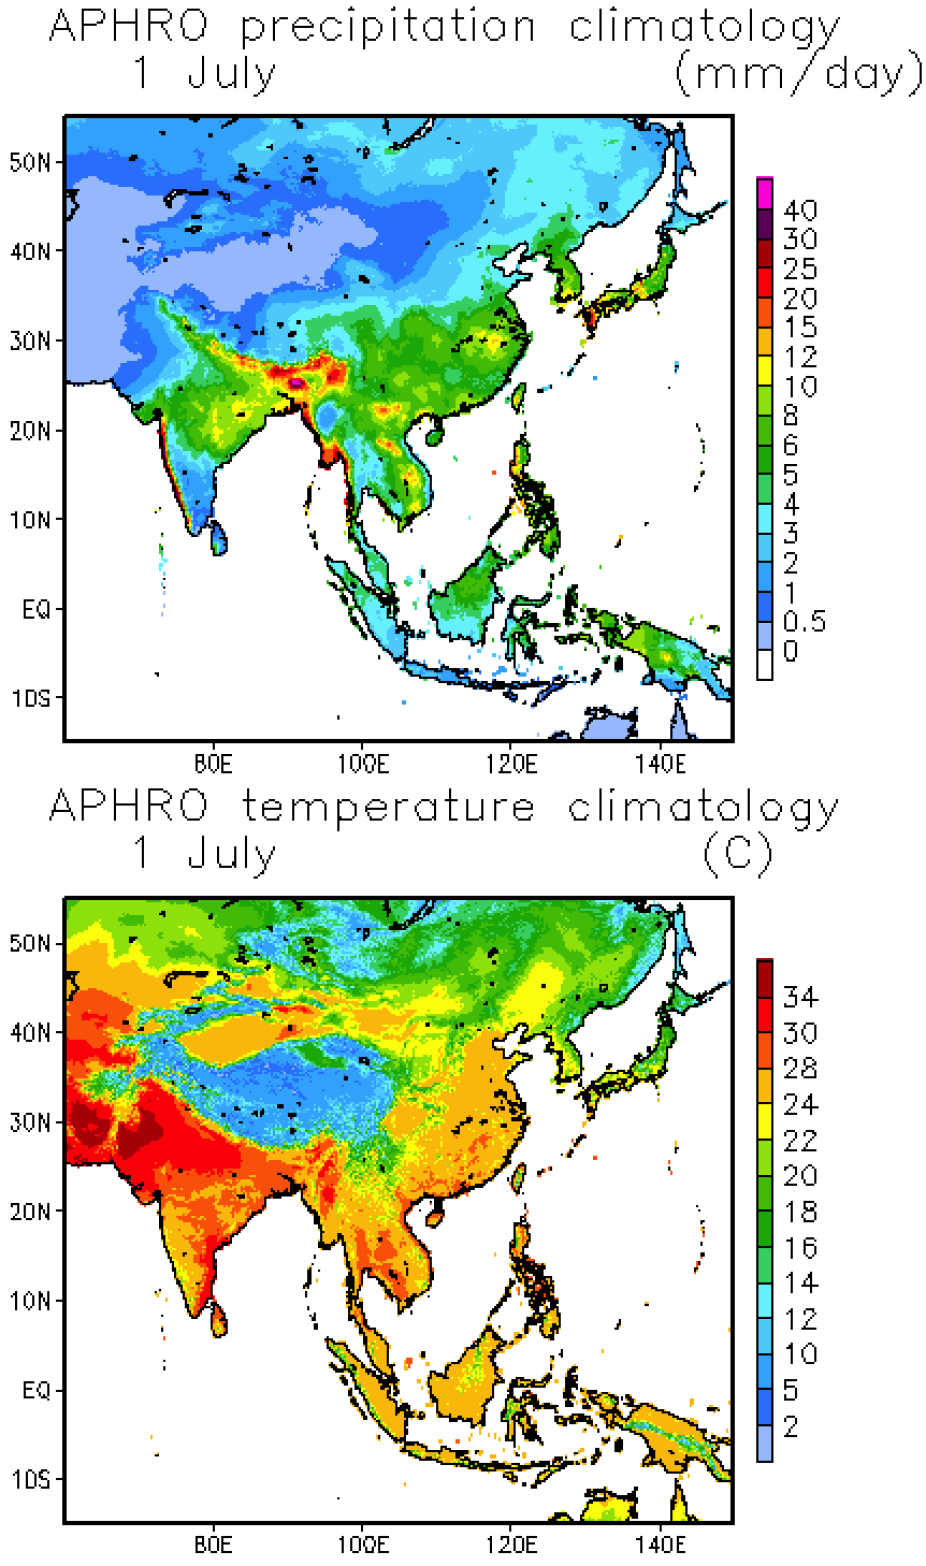
Figure 5. Daily climatology for 1 July of precipitation (top panel) and temperature (bottom panel). (Contributed by A. Yatagai)
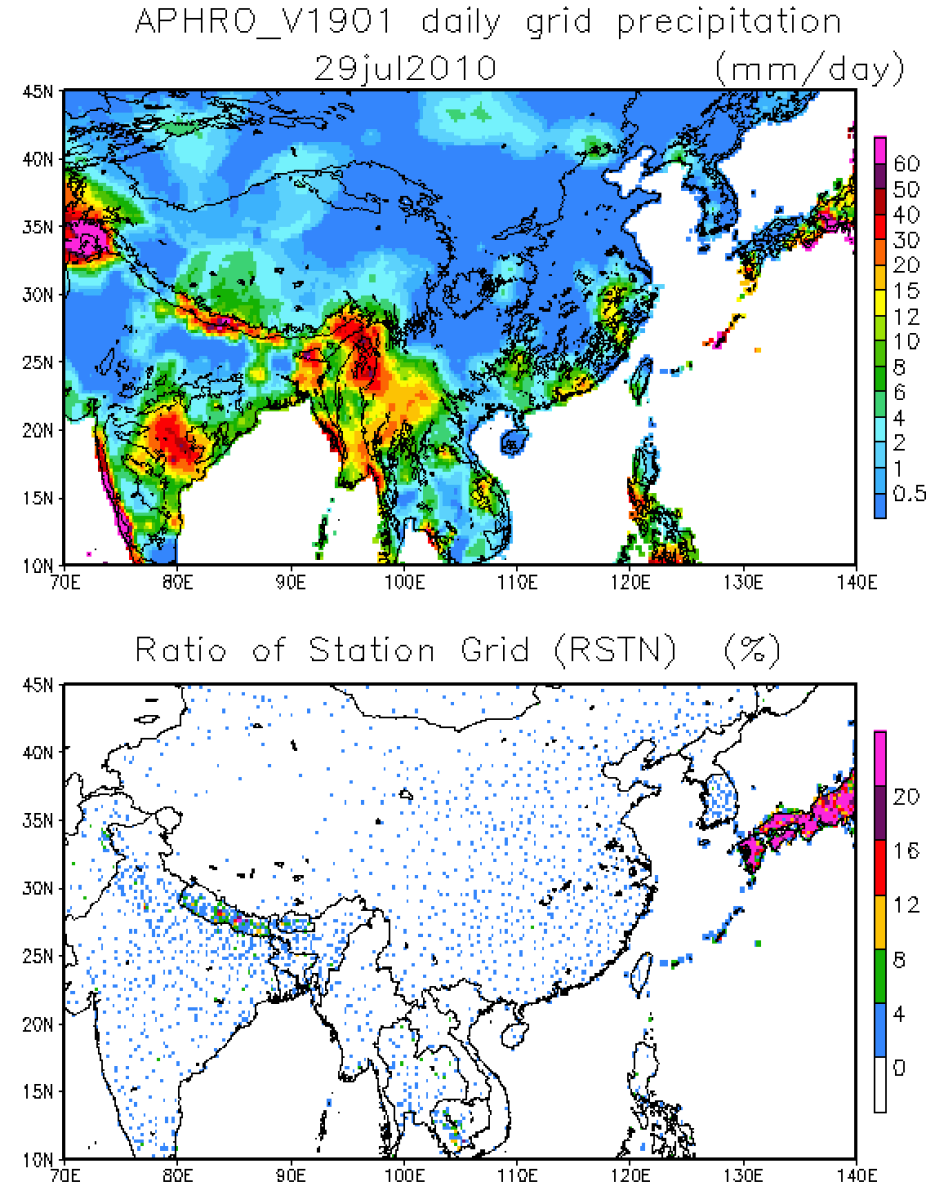
Figure 6 . Daily precipitation amount for 29 July 2010 (top panel) compared with the RSTN metric (bottom panel)(Contributed by A. Yatagai)
Other Information
- Hamada, A., O. Arakawa and A. Yatagai (2011): An automated quality control method for daily rain-gauge data, Global Environmental Research, V15N2, 183-192.
- Kamiguchi, K., O. Arakawa, A. Kitoh, A. Yatagai, A. Hamada, and N. Yasutomi, 2010: Development of APHRO_JP, the first Japanese high-resolution daily precipitation product for more than 100 years. Hydrological Research Letters, 4, 60–64.
- Yasutomi, N., A. Hamada and A. Yatagai (2011): Development of a long-term daily gridded temperature dataset and its application to rain/snow discrimination of daily precipitation, Global Environmental Research, V15N2, 165-172.
- Yatagai, A., P. Xie, and P. Alpert, 2008: Development of a daily gridded precipitation data set for the Middle East. Advances in Geosciences, 12, 165–170, https://doi.org/10.5194/adgeo-12-165-2008.
- Yatagai, A., K. Kamiguchi, O. Arakawa, A. Hamada, N. Yasutomi and A. Kitoh (2012): APHRODITE: Constructing a Long-term Daily Gridded Precipitation Dataset for Asia based on a Dense Network of Rain Gauges, Bulletin of American Meteorological Society.
- Yatagai, A., M. Maeda, S. Khadgarai, M. Masuda and P. Xie (2020): End of the Day (EOD) Judgment for Daily Rain-Gauge Data, Atmosphere, 11(8), 772, DOI: 10.3390/atmos11080772.