Climate Data
The Climate Data Guide is a high-traffic expert knowledge portal providing concise and reliable information on the data that are essential for monitoring and understanding the Earth System. Currently, it curates expert insights on over 200 observational datasets and indices, searchable or browseable in the list below.
To find a specific dataset or climate variable, jump to the the search box. For only the datasets paired with guidance written by experts, select the "Datasets with guidance" button when using the search box.
Data creators, data publishers, and scientists who use climate data are invited to join our Network of Experts by contributing commentaries on data strengths and limitations to the Climate Data Guide. What type of data are included? See this discussion.
With the exception of about 25 climate indices, the Climate Data Guide does not host datasets. Data cannot be downloaded from this site. However, links are provided to download locations under the "Data Access" section of each dataset page.
Citation: Please link to this website in your work that draws upon material from this website, and cite this paper:
Schneider, D. P., C. Deser, J. Fasullo, and K. E. Trenberth, 2013: Climate Data Guide Spurs Discovery and Understanding. Eos Trans. AGU, 94, 121–122, https://doi.org/10.1002/2013eo130001.
=> Additionally, each dataset page with expert-written guidance has its own citation example on the individual page, such that the experts who wrote the guidance may be credited. Finally, responsible use and citation of datasets is strongly encouraged.
Climate datasets
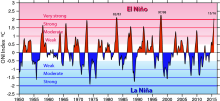 Nino SST Indices (Nino 1+2, 3, 3.4, 4; ONI and TNI)
Years of Record
- 1870-01 to 2023-04
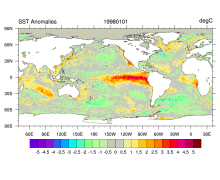
There are several indices used to monitor the tropical Pacific, all of which are based on sea surface temperature (SST) anomalies averaged across a given region. Usually the anomalies are computed relative to a base period of 30 years. The Niño 3.4 index…
-
Formats
- ascii
-
Timestep
- Monthly
-
Domain
- Pacific Ocean, Tropics
-
Collections
- Climate Analysis Section (CAS) Data Catalog
Experts contributing reviews
- Trenberth, Kevin
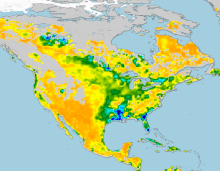
 Standardized Precipitation Index (SPI)
Years of Record
- 1949-01 to 2018-07
The Standardized Precipitation Index (SPI) is a widely used index to characterize meteorological drought on a range of timescales. On short timescales, the SPI is closely related to soil moisture, while at longer timescales, the SPI can be related to groundwater and…
-
Formats
-
Timestep
- Monthly
-
Domain
-
Collections
- None
Experts contributing reviews
- Keyantash, John
 Palmer Drought Severity Index (PDSI)
Years of Record
The Palmer Drought Severity Index (PDSI) uses readily available temperature and precipitation data to estimate relative dryness. It is a standardized index that generally spans -10 (dry) to +10 (wet). Maps of operational agencies like NOAA typically show a range of -4 to…
-
Timestep
- Monthly
-
Domain
- Global
-
Collections
- Climate Analysis Section (CAS) Data Catalog
Experts contributing reviews
- Dai, Aiguo | Bui, Sang | Lenssen, Nathan
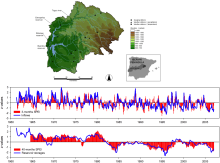 Standardized Precipitation Evapotranspiration Index (SPEI)
Years of Record
- 1901-01 to 2014-03
The Standardized Precipitation Evapotranspiration Index (SPEI) is an extension of the widely used Standardized Precipitation Index (SPI). The SPEI is designed to take into account both precipitation and potential evapotranspiration (PET) in determining drought. Thus,…
Main variables and Earth System components
Experts contributing reviews
- Vicente-Serrano, Sergio M.
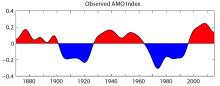 Atlantic Multi-decadal Oscillation (AMO) and Atlantic Multidecadal Variability (AMV)
Years of Record
- 1870-01 to 2021-03
The Atlantic Multi-decadal Oscillation (AMO) has been identified as a coherent mode of natural variability occurring in the North Atlantic Ocean with an estimated period of 60-80 years. It is based upon the average anomalies of sea surface temperatures (SST) in the North…
-
Timestep
- Monthly, Decadal
-
Collections
- Climate Analysis Section (CAS) Data Catalog
Experts contributing reviews
- Trenberth, Kevin | Zhang, Rong
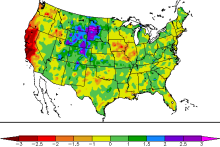
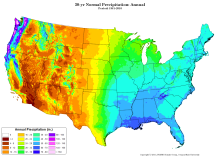 PRISM High-Resolution Spatial Climate Data for the United States: Max/min temp, dewpoint, precipitation
Years of Record
- 1895-01 to 2023-04
PRISM is a set of monthly, yearly, and single-event gridded data products of mean temperature and precipitation, max/min temperatures, and dewpoints, primarily for the United States. In-situ point measurements are ingested into the PRISM (Parameter elevation Regression on…
Main variables and Earth System components
Atmosphere Dew Point Temperature Maximum Air Temperature Minimum Air Temperature Precipitation-
Formats
- ARC/INFO ASCII GRID | netCDF
-
Timestep
- Climatology, Daily, Monthly
-
Domain
- North America
-
Collections
- None
Experts contributing reviews
- Daly, Christopher
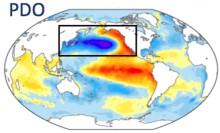 Pacific Decadal Oscillation (PDO): Definition and Indices
Years of Record
- 1900-01 to 2015-12
The Pacific Decadal Oscillation (PDO) is defined by the leading pattern (EOF) of sea surface temperature (SST) anomalies in the North Pacific basin (typically, polewards of 20°N). The SST anomalies are obtained by removing both the climatological annual cycle and…
-
Formats
- ascii
-
Timestep
- Monthly
-
Domain
- Pacific Ocean
-
Collections
- None
Experts contributing reviews
- Deser, Clara | Trenberth, Kevin
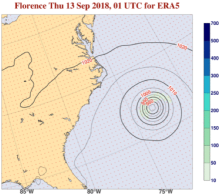 ERA5 atmospheric reanalysis
Years of Record
- 1940-01 to 2023-07
ERA5, the successor to ERA-Interim, provides global, hourly estimates of atmospheric, ocean-wave and land-surface variables, at a horizontal resolution of 31 km and 137 levels in the vertical from the surface to 0.01 hPa (about 80km). Produced by ECMWF on behalf of the…
-
Timestep
- Sub-daily, Daily, Monthly
-
Domain
- Global
-
Collections
- Diagnostic Data Sets
Experts contributing reviews
- Hersbach, Hans
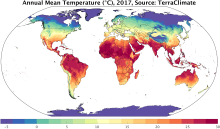 TerraClimate: Global, high-resolution gridded temperature, precipitation, and other water balance variables
Years of Record
- 1958-01 to 2018-12
TerraClimate is a global gridded dataset of meteorological and water balance variables for 1958-present, available on a monthly timestep. Its relatively fine spatial resolution, global extent, and long length are a unique combination that fills a void in climate data…
Main variables and Earth System components
Atmosphere Air Temperature Maximum Air Temperature Minimum Air Temperature Potential Evapotranspiration Precipitation Wind Snow Water Equivalent Land evapotranspiration Runoff and Streamflow Soil MoistureExperts contributing reviews
- Abatzoglou, John
 JRA-55
Years of Record
- 1957-12 to 2022-02
Spanning 1958-present, JRA-55 is the longest third-generation reanalysis that uses the full observing system (in contrast, products like ERA-20C and NOAA 20CR assimilate a very limited set of observations while NCEP R1 uses an antiquated model and assimilation scheme).…
Main variables and Earth System components
Atmosphere Air Temperature Geopotential Height Precipitable waterExperts contributing reviews
- Kobayashi, Shinya
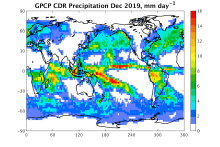 GPCP (Monthly): Global Precipitation Climatology Project
Years of Record
- 1979-01 to 2020-07
Data from rain gauge stations, satellites, and sounding observations have been merged to estimate monthly rainfall on a 2.5-degree global grid from 1979 to the present. The careful combination of satellite-based rainfall estimates provides the most complete analysis of…
-
Timestep
- Climatology, Monthly
-
Domain
- Global
Experts contributing reviews
- Pendergrass, Angeline | Wang, Jian-Jian
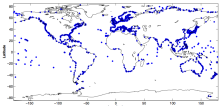
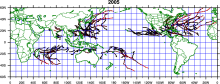 IBTrACS: Tropical cyclone best track data
Years of Record
IBTrACS (International Best Track Archive for Climate Stewardship) provides global tropical cyclone best track data in a centralized location to aid our understanding of the distribution, frequency, and intensity of tropical cyclones worldwide. The World Meteorological…
Experts contributing reviews
- Schreck, Carl
 Hurrell North Atlantic Oscillation (NAO) Index (station-based)
Years of Record
- 1865-01 to 2023-06
The winter (December thru March) station-based index of the NAO is based on the difference of normalized sea level pressure (SLP) between Lisbon, Portugal and Stykkisholmur/Reykjavik, Iceland since 1864. Positive values of the NAO index are typically associated with…
-
Formats
- ascii
-
Timestep
- Monthly, Seasonal, Annual
-
Domain
- Atlantic Ocean
-
Collections
- Climate Analysis Section (CAS) Data Catalog
Experts contributing reviews
- Hurrell, James | Phillips, Adam
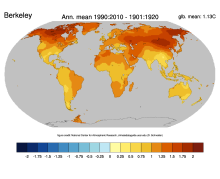 Global surface temperatures: BEST: Berkeley Earth Surface Temperatures
Years of Record
- 1701-01 to 2019-07
The Berkeley Earth Surface Temperatures (BEST) are a set of data products, originally a gridded reconstruction of land surface air temperature records spanning 1701-present, and now including an 1850-present merged land-ocean data set that combines the land…
Main variables and Earth System components
Atmosphere Air Temperature Maximum Air Temperature Minimum Air Temperature Ocean SST - sea surface temperatureExperts contributing reviews
- Cowtan, Kevin
 GPCC: Global Precipitation Climatology Centre
Years of Record
- 1891-01 to 2018-12
The GPCC provides gridded gauge-analysis products derived from quality controlled station data. Two products are for climate: (a) the Full Data Reanalysis Product (1901-2010) is recommended for global and regional water balance studies, calibration/validation of…
-
Timestep
- Climatology, Daily, Monthly
-
Domain
- Global
Experts contributing reviews
- None
 Atmospheric Reanalysis: Overview & Comparison Tables
Years of Record
Reanalysis a systematic approach to produce data sets for climate monitoring and research. Reanalyses are created via an unchanging ("frozen") data assimilation scheme and model(s) which ingest all available observations every 6-12 hours over the period being analyzed.…
Main variables and Earth System components
Atmosphere-
Formats
-
Timestep
-
Domain
Experts contributing reviews
- Dee, Dick | Fasullo, John | Shea, Dennis | Walsh, John
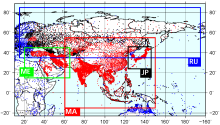 APHRODITE: Asian Precipitation - Highly-Resolved Observational Data Integration Towards Evaluation of Water Resources
Years of Record
- 1951-01 to 2015-12
APHRODITE’s (Asian Precipitation - Highly-Resolved Observational Data Integration Towards Evaluation) gridded precipitation is a set of long-term (1951 onward) continental-scale daily products that is based on a dense network of rain-gauge data for Asia including the…
Experts contributing reviews
- Maeda, Mio | Yasutomi, Natsuko | Yatagai, Akiyo
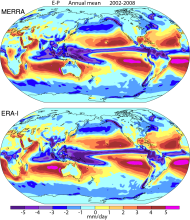
 NASA's MERRA2 reanalysis
Years of Record
- 1980-01 to 2017-11
The Modern-Era Retrospective analysis for Research and Applications, version 2 (MERRA-2) is a global atmospheric reanalysis produced by the NASA Global Modeling and Assimilation Office (GMAO). It spans the satellite observing era from 1980 to the present. The goals of…
Main variables and Earth System components
Atmosphere Aerosols Air Temperature Geopotential Height Precipitable waterExperts contributing reviews
- Bosilovich, Michael | Cullather, Richard
 Southern Oscillation Indices: Signal, Noise and Tahiti/Darwin SLP (SOI)
Years of Record
- 1866-01 to 2025-03
The Southern Oscillation Index (SOI) is a time series used to characterize the large scale sea level pressure (SLP) patterns in the tropical Pacific. Monthly mean SLP at Tahiti [T] and Darwin [D] are used. An optimal SOI can be constructed. It consists of [T-D]…
-
Timestep
- Monthly
-
Domain
- Australia, Pacific Ocean, Tropics
-
Collections
- Climate Analysis Section (CAS) Data Catalog
Experts contributing reviews
- Trenberth, Kevin
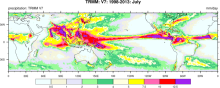 TRMM: Tropical Rainfall Measuring Mission
Years of Record
- 1998-01 to 2019-12
The Tropical Rainfall Measuring Mission (TRMM) is a joint space mission between NASA and Japan's National Space Development Agency designed to monitor and study tropical and subtropical precipitation and the associated release of energy. The mission uses 5 instruments:…
-
Timestep
- Sub-daily, Daily, Monthly
-
Domain
- Tropics
-
Collections
- Climate Analysis Section (CAS) Data Catalog, Obs4MIPS
Experts contributing reviews
- Huffman, George J. | Pendergrass, Angeline
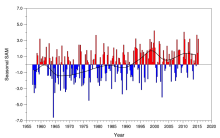 Marshall Southern Annular Mode (SAM) Index (Station-based)
Years of Record
- 1957-01 to 2015-09
The station-based index of the Southern Annular Mode (SAM) is based on the zonal pressure difference between the latitudes of 40S and 65S. As such, the SAM index measures a "see-saw" of atmospheric mass between the middle and high latitudes of the Southern…
-
Formats
- ascii
-
Timestep
-
Collections
- None
Experts contributing reviews
- Marshall, Gareth
 ERA-Interim
Years of Record
- 1979-01 to 2019-09
Using a much improved atmospheric model and assimilation system from those used in ERA-40, ERA-Interim represents a third generation reanalysis. Several of the inaccuracies exhibited by ERA-40 such as too-strong precipitation over oceans from the early 1990's onwards and…
Main variables and Earth System components
Atmosphere Air Temperature Geopotential Height Precipitable water Precipitation-
Timestep
- Sub-daily, Daily, Monthly
-
Domain
- Global
Experts contributing reviews
- Dee, Dick
 SST data: NOAA High-resolution (0.25x0.25) Blended Analysis of Daily SST and Ice, OISSTv2
Years of Record
- 1981-09 to 2022-02
"NOAA’s Optimum Interpolation Sea Surface temperature (OISST, also known as Reynolds’ SST) is a series of global analysis products, including the weekly OISST on a 1° grid to the more recent daily on a ¼° grid. An SST analysis is a spatially gridded product created by…
Main variables and Earth System components
Cryosphere Sea Ice Concentration Ocean SST - sea surface temperatureExperts contributing reviews
- Banzon, Viva | Reynolds, Richard
 Hurrell North Atlantic Oscillation (NAO) Index (PC-based)
Years of Record
- 1899-01 to 2025-03
The principal component (PC)-based indices of the North Atlantic Oscillation (NAO) are the time series of the leading Empirical Orthogonal Function (EOF) of SLP anomalies over the Atlantic sector, 20°-80°N, 90°W-40°E. These indices are used to measure the NAO…
-
Formats
- ascii
-
Timestep
- Monthly, Seasonal, Annual
-
Domain
- Atlantic Ocean
-
Collections
- Climate Analysis Section (CAS) Data Catalog
Experts contributing reviews
- Hurrell, James | Phillips, Adam
 Global surface temperature data: GISTEMP: NASA Goddard Institute for Space Studies (GISS) Surface Temperature Analysis
Years of Record
- 1880-01 to 2020-03
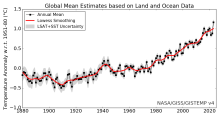
NASA Goddard's Global Surface Temperature Analysis (GISTEMP) combines land surface air temperatures from GHCN-M version 4 with SSTs of the ERSSTv5 analysis into a comprehensive, global surface temperature data set spanning 1880 to the present at monthly resolution, on a…
Main variables and Earth System components
Atmosphere Air Temperature Ocean SST - sea surface temperature-
Timestep
- Monthly
-
Domain
- Global
Experts contributing reviews
- Lenssen, Nathan
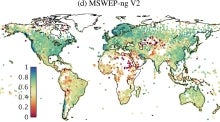 Global high-resolution precipitation: MSWEP
Years of Record
- 1979-01 to 2023-07
Multi-Source Weighted-Ensemble Precipitation (MSWEP) is a sub-daily precipitation dataset with full global coverage at 0.1° resolution, spanning the period 1979 to present. It is updated in near real-time with a latency of three hours, making it suitable for…
Experts contributing reviews
- Beck, Hylke
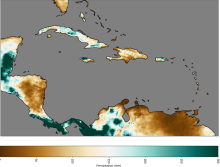 CHIRPS: Climate Hazards InfraRed Precipitation with Station data (version 2)
Years of Record
- 1981-01 to 2023-02
Note: CHIRPS v2 has been superseded by CHIRPS v3 as of June 2025. Climate Hazards Group InfraRed Precipitation with Station data (CHIRPS) is a quasi-global (50S - 50N), land-only rainfall dataset with a range of temporal and spatial resolutions depending on the region and…
Experts contributing reviews
- Touma, Danielle | Martinez, Carlos
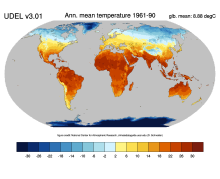 Global (land) precipitation and temperature: Willmott & Matsuura, University of Delaware
Years of Record
- 1900-01 to 2014-12
A series of gridded temperature and precipitation data sets. Station records that served as bases for the Terrestrial Air Temperature: 1900-2014 Gridded Monthly Time Series (Version 4.01) and Terrestrial Precipitation: 1900-2014 Gridded Monthly Time Series (Version 4.01)…
Main variables and Earth System components
Atmosphere Air Temperature Air Temperature at 2m Precipitation-
Timestep
- Climatology, Monthly
-
Domain
- Global
-
Collections
- Diagnostic Data Sets, NCAR-DOE-CESM, atmosdiagnostics
Experts contributing reviews
- Matsuura, Kenji
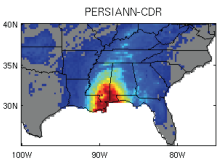 PERSIANN-CDR: Precipitation Estimation from Remotely Sensed Information using Artificial Neural Networks - Climate Data Record
Years of Record
- 1983-01 to 2021-09
The Precipitation Estimation from Remotely Sensed Information using Artificial Neural Networks- Climate Data Record (PERSIANN-CDR) provides daily rainfall estimates at a spatial resolution of 0.25 degrees in the latitude band 60S - 60N from 1983 to the near-…
-
Timestep
- Sub-daily, Daily
-
Domain
- Global
-
Collections
- Climate Data Record
Experts contributing reviews
- Ashouri, Hamed | Gehne, Maria
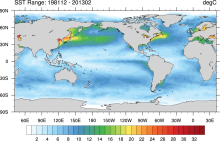
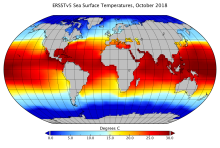 SST Data: NOAA Extended Reconstruction SSTs Version 5 (ERSSTv5)
Years of Record
- 1854-01 to 2019-08
Note: ERSST is currently on version 6. See the ERSSTv6 page here. The NOAA Extended Reconstruction Sea Surface Temperature (ERSST) provides global, spatially complete SST data at a monthly timestep for 1854-present. Version5 is based upon statistical interpolation…
-
Timestep
- Climatology, Monthly
-
Domain
- Global
-
Collections
- Diagnostic Data Sets
Experts contributing reviews
- Hausfather, Zeke
 Soil Moisture Data Sets: Overview & Comparison Tables
Years of Record
Soil moisture is a state variable of the land that crosses the interfaces of several disciplines, including meteorology, hydrology, climatology and ecology. Soil moisture content controls the partitioning of net radiation at the land surface between sensible and latent…
-
Formats
-
Timestep
-
Domain
-
Collections
- Overview / Comparison page
Experts contributing reviews
- Dirmeyer, Paul
Years of Record
- 1850 to Present
This overview focuses on SST datasets designed for climate applications. The focus is on datasets with coverage back to around 1850 at monthly resolution but select datasets over the satellite era that have been specifically developed as climate monitoring resources are…
-
Formats
-
Timestep
- Climatology, Daily, Monthly, Weekly
-
Domain
- Global
-
Collections
- Overview / Comparison page
Experts contributing reviews
- Chan, Duo | Kent, Elizabeth
 IMERG precipitation algorithm and the Global Precipitation Measurement (GPM) Mission
Years of Record
- 2000-06 to 2023-07
IMERG (Integrated Multi-satellitE Retrievals for the Global Precipitation Measurement) is NASA's updated precipitation algorithm, while the Global Precipitation Measurement (GPM) mission is an international satellite mission launched by NASA and JAXA on Feb. 27, 2014. The…
Experts contributing reviews
- Huffman, George J. | Tan, Jackson
 Tide gauge sea level data
Years of Record
- 1800-01 to 2016-01
The global sea level record from tide gauges is an important indicator of the evolution and impact of global change. Tide gauge data also capture a variety of local and regional phenomena related to decadal climate variability, tides, storm surges, tsunamis, swells,…
-
Formats
-
Timestep
- Sub-daily, Daily, Monthly, Annual
-
Domain
- Global
-
Collections
- None
Experts contributing reviews
- Hamlington, Benjamin | Thompson, Phil
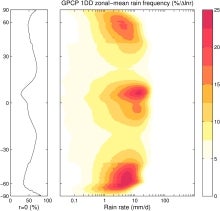 GPCP (Daily): Global Precipitation Climatology Project
Years of Record
- 1996-10 to 2015-11
The 1DD product provides precipitation estimates on a 1-degree grid over the entire globe at 1-day (daily) for the period October 1996 - present. Both the Pentad and 1DD products are consistent with the Version 2 monthly product in the sense that the Pentad and 1DD…
Experts contributing reviews
- Pendergrass, Angeline
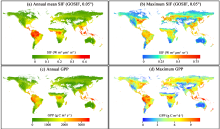 Global dataset of solar-induced chlorophyll fluorescence (GOSIF)
Years of Record
- 2000-02 to 2022-12
GOSIF is a global, gridded dataset of solar-induced chlorophyll fluorescence (SIF). SIF, an energy flux re-emitted by plants a few nanoseconds after light absorption, exhibits a strong linear relationship with gross primary production (GPP) at the ecosystem scale and…
Main variables and Earth System components
Biosphere GPP: Gross Primary Production solar-induced chlorophyll fluorescence (SIF) Land Gross Primary Production-
Formats
-
Timestep
- Monthly, Weekly
-
Domain
- Global
-
Collections
- None
Experts contributing reviews
- Xiao, Jingfeng | Li, Xing
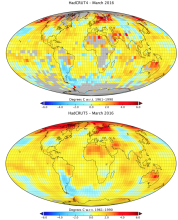 Global land-ocean surface temperature data: HadCRUT5
Years of Record
- 1850-01 to 2020-12
HadCRUT5 is one of the main datasets used to monitor global and regional surface temperature variability and trends. It is a global surface temperature product that combines land surface air temperatures from CRUTEM5 with SSTs from HadSST4. HadCRUT5 is a departure from…
Main variables and Earth System components
Atmosphere Air Temperature at 2m Ocean SST - sea surface temperature-
Formats
- netCDF
-
Timestep
- Monthly
-
Domain
- Global
-
Collections
- Diagnostic Data Sets
Experts contributing reviews
- Hausfather, Zeke
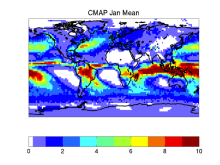 CMAP: CPC Merged Analysis of Precipitation
Years of Record
- 1979-01 to 2020-03
CMAP refers to a collection of precipitation data sets, though the 2.5°x2.5° global monthly version is probably the most widely used. This data set is constructed from an analysis of gauge data and satellite-derived precipitation estimates. An "enhanced" version (CMAP/A)…
-
Timestep
- Monthly, Pentad
-
Domain
- Global
Experts contributing reviews
- Arkin, Phil | Xie, PIngping
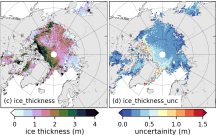 Sea Ice Thickness Data Sets: Overview & Comparison Table
Years of Record
- 1979-01 to 2023-08
While satellite observations of sea ice extent and concentration are available from 1979, long-term high quality (daily and high spatial resolution) observations of sea ice thickness remain limited as a result of few satellite and in situ observations. Reconstructions…
Experts contributing reviews
- Labe, Zachary | Tilling, Rachel
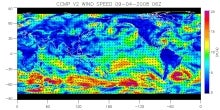 CCMP: Cross-Calibrated Multi-Platform wind vector analysis
Years of Record
- 1987-07 to 2016-05
The CCMP wind analysis is a near-global, high spatial and temporal resolution gridded dataset of surface wind vectors spanning 1987-present. The input data are a combination of inter-calibrated satellite data from numerous radiometers and scatterometers and in-situ…
Experts contributing reviews
- Ricciardulli, Lucrezia
 SST data: NOAA Optimal Interpolation (OI) SST Analysis, version 2 (OISSTv2) 1x1
Years of Record
- 1981-12 to 2020-03
The NOAA Optimal Interpolation SST analysis provides global, spatially complete SSTs on a weekly and monthly basis for 1982-present.
Experts contributing reviews
- Banzon, Viva | Reynolds, Richard
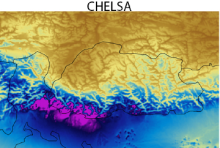 CHELSA high-resolution land surface temperature and precipitation
Years of Record
- 1979-01 to 2013-12
The Climatologies at high resolution for the Earth's land surface (CHELSA) dataset contains high spatial resolution monthly climatologies of mean, maximum and minimum temperatures and mean precipitation, representing the period 1979-2013. CHELSA is essentially a…
Experts contributing reviews
- Karger, Dirk
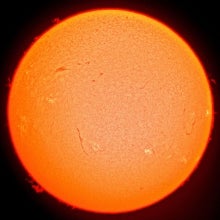 Total Solar Irradiance (TSI) datasets: An overview
Years of Record
- 1610-01 to 2016-03
The solar radiation arriving at Earth (once known as the “solar constant”, now usually referred to as Total Solar Irradiance (TSI)), is the most fundamental of climate parameters as it indicates the totality of the energy driving the climate system. All climate…
-
Formats
-
Timestep
-
Domain
- Global
-
Collections
- None
Experts contributing reviews
- Ball, William | Haigh, Joanna
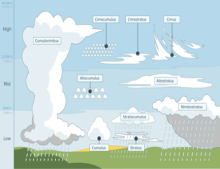 Cloud Dataset Overview
Years of Record
- 1982-01 to 2009-12
Clouds cover about 70% of the earth's surface. They are important components of the cliimate's water and energy budgets. Historically, cloud reports have come from station or ship observations. The satellite observation era, beginning in the 1980’s and spanning now…
-
Formats
-
Timestep
- Climatology, Monthly
-
Domain
- Global
-
Collections
- Overview / Comparison page
Experts contributing reviews
- Stubenrauch, Claudia
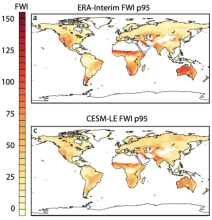 Canadian Forest Fire Weather Index (FWI)
Years of Record
Fire weather indices are used to quantify the meteorological conditions that can lead to fire ignition and spread. They are used to communicate fire danger levels to emergency and fire fighting management, as well as the public on short time scales, and also for…
Main variables and Earth System components
Atmosphere-
Formats
-
Timestep
-
Domain
-
Collections
- None
Experts contributing reviews
- Touma, Danielle
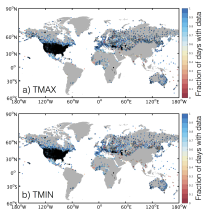 GHCN-D: Global Historical climatology Network daily temperatures
Years of Record
- 1880-01 to 2023-09
The Global Historical Climatology Network Daily database, GHCN-D, contains meteorological measurements from over 90,000 stations across the globe. The majority of station records contain precipitation data only, however other key variables including maximum…
Main variables and Earth System components
Atmosphere Maximum Air Temperature Minimum Air Temperature PrecipitationExperts contributing reviews
- McKinnon, Karen
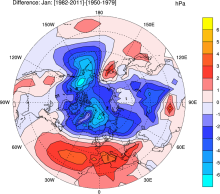 NCAR Sea Level Pressure
Years of Record
- 1899-01 to 2022-01
NCAR Sea Level Pressure is a gridded analysis of SLP based on land station reports, covering 1899 to present for latitudes 30°N-90°N. Quality controlled raw data plus empirical corrections for changes in instrumentation and station location.
-
Timestep
-
Domain
- NH - Northern Hemisphere
-
Collections
- Climate Analysis Section (CAS) Data Catalog
Experts contributing reviews
- Hurrell, James | Trenberth, Kevin
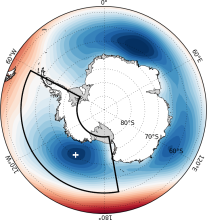 Amundsen Sea Low indices
Years of Record
- 1959-01 to 2022-12
The Amundsen Sea Low (ASL) is a climatological low pressure center located over the extreme southern Pacific Ocean, off the coast of West Antarctica. Atmospheric variability in this region is larger than anywhere else in the Southern Hemisphere, and exhibits…
-
Timestep
- Monthly, Seasonal, Annual
-
Collections
- None
Experts contributing reviews
- Hosking, Scott
 Tree-ring width chronologies: An overview of their use as climate proxies and of available databases
Years of Record
The width of an annual tree ring is a very simple indicator of the character of that year’s weather, but collectively the global network of tree-ring width measurements represents an invaluable resource for high-resolution paleoclimatology.
Main variables and Earth System components
-
Formats
-
Timestep
- Annual
-
Domain
- Global
-
Collections
- None
Experts contributing reviews
- St. George, Scott
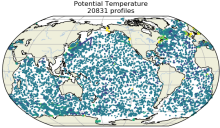 EN4 subsurface temperature and salinity for the global oceans
Years of Record
- 1900-01 to 2019-12
EN4 is a subsurface temperature and salinity dataset for the global oceans, spanning 1900 to present at a monthly timestep. It includes two types of data products: (1) a database of quality-controled in situ profiles and (2) a spatially complete analyses at 1 by 1 degree…
Main variables and Earth System components
Ocean potential temperature Sub Surface Salinity Sub Surface Temperature Sub-surface dataExperts contributing reviews
- Killick, Rachel