Climate Data
The Climate Data Guide is a high-traffic expert knowledge portal providing concise and reliable information on the data that are essential for monitoring and understanding the Earth System. Currently, it curates expert insights on over 200 observational datasets and indices, searchable or browseable in the list below.
To find a specific dataset or climate variable, jump to the the search box. For only the datasets paired with guidance written by experts, select the "Datasets with guidance" button when using the search box.
Data creators, data publishers, and scientists who use climate data are invited to join our Network of Experts by contributing commentaries on data strengths and limitations to the Climate Data Guide. What type of data are included? See this discussion.
With the exception of about 25 climate indices, the Climate Data Guide does not host datasets. Data cannot be downloaded from this site. However, links are provided to download locations under the "Data Access" section of each dataset page.
Citation: Please link to this website in your work that draws upon material from this website, and cite this paper:
Schneider, D. P., C. Deser, J. Fasullo, and K. E. Trenberth, 2013: Climate Data Guide Spurs Discovery and Understanding. Eos Trans. AGU, 94, 121–122, https://doi.org/10.1002/2013eo130001.
=> Additionally, each dataset page with expert-written guidance has its own citation example on the individual page, such that the experts who wrote the guidance may be credited. Finally, responsible use and citation of datasets is strongly encouraged.
Climate datasets
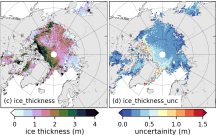 Sea Ice Thickness Data Sets: Overview & Comparison Table
Years of record
- to
While satellite observations of sea ice extent and concentration are available from 1979, long-term high quality (daily and high spatial resolution) observations of sea ice thickness remain limited as a result of few satellite and in situ observations. Reconstructions…
Experts contributing reviews
- Labe, Zachary | Tilling, Rachel
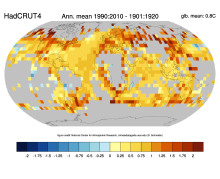 Global surface temperature data: HadCRUT4 and CRUTEM4
Years of record
- to
Extending back to 1850 and frequently updated, HadCRUT4 is the longest data set of its type. HadCRUT4 is a combination of the global land surface temperature data set, CRUTEM4 and the global SST data set, HadSST3. HadCRUT4 is different from the most closely comparable…
Main variables and Earth System components
Atmosphere Air Temperature Ocean SST - sea surface temperature-
Timestep
- Climatology, Monthly
-
Domain
- Global
Experts contributing reviews
- None
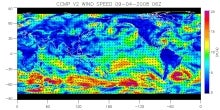 CCMP: Cross-Calibrated Multi-Platform wind vector analysis
Years of record
- to
The CCMP wind analysis is a near-global, high spatial and temporal resolution gridded dataset of surface wind vectors spanning 1987-present. The input data are a combination of inter-calibrated satellite data from numerous radiometers and scatterometers and in-situ…
Experts contributing reviews
- Ricciardulli, Lucrezia
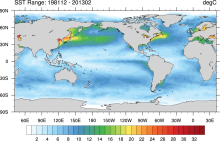 SST data: NOAA Optimal Interpolation (OI) SST Analysis, version 2 (OISSTv2) 1x1
Years of record
- to
The NOAA Optimal Interpolation SST analysis provides global, spatially complete SSTs on a weekly and monthly basis for 1982-present.
Experts contributing reviews
- Banzon, Viva | Reynolds, Richard
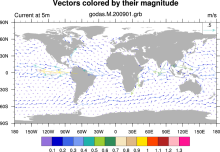 GODAS: NCEP Global Ocean Data Assimilation System
Years of record
- to
GODAS is a real-time ocean analysis and a reanalysis. It is used for monitoring, retrospective analysis as well as for providing oceanic initial conditions for the CFS. Both temperature and synthetic salinity profiles are assimilated in a 3DVAR scheme. Beginning with March…
Main variables and Earth System components
Ocean 3D Velocity SST - sea surface temperature Salinity heat flux isothermal layer depth mixed layer depth potential temperature salt flux sea surface height-
Timestep
- Monthly, Pentad
-
Domain
- Global
-
Collections
- Climate Analysis Section (CAS) Data Catalog
Experts contributing reviews
- None
 North Pacific (NP) Index by Trenberth and Hurrell; monthly and winter
Years of record
- to
The North Pacific Index (NP index or NPI) is the area-weighted sea level pressure over the region 30°N-65°N, 160°E-140°W. The NP index is defined to measure interannual to decadal variations in the atmospheric circulation. The dominant atmosphere-ocean relation in the…
-
Formats
- ascii
-
Timestep
- Monthly, Seasonal
-
Collections
- Climate Analysis Section (CAS) Data Catalog
Experts contributing reviews
- Hurrell, James | Phillips, Adam
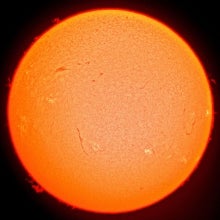 Total Solar Irradiance (TSI) datasets: An overview
Years of record
- to
The solar radiation arriving at Earth (once known as the “solar constant”, now usually referred to as Total Solar Irradiance (TSI)), is the most fundamental of climate parameters as it indicates the totality of the energy driving the climate system. All climate…
-
Formats
-
Timestep
-
Domain
- Global
-
Collections
- None
Experts contributing reviews
- Ball, William | Haigh, Joanna
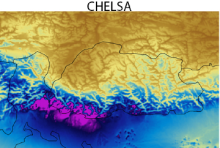 CHELSA high-resolution land surface temperature and precipitation
Years of record
- to
The Climatologies at high resolution for the Earth's land surface (CHELSA) dataset contains high spatial resolution monthly climatologies of mean, maximum and minimum temperatures and mean precipitation, representing the period 1979-2013. CHELSA is essentially a…
Experts contributing reviews
- Karger, Dirk
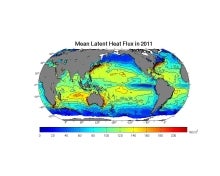 OAFlux: Objectively Analyzed air-sea Fluxes for the global oceans.
Years of record
- to
"The OAFlux project aims to provide consistent, multi-decade, global analysis of air-sea heat, freshwater (evaporation), and momentum fluxes for use in studies of global energy budget, water cycle, atmosphere and ocean circulation, and climate. The OAFlux project is so…
Main variables and Earth System components
Atmosphere Latent & sensible heat flux Radiation Wind Ocean SST - sea surface temperature Surface Flux wind stress curlExperts contributing reviews
- None
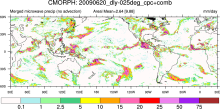 CMORPH (CPC MORPHing technique): High resolution precipitation (60S-60N)
Years of record
- to
"CMORPH (CPC MORPHing technique) produces global precipitation analyses at very high spatial and temporal resolution. This technique uses precipitation estimates that have been derived from low orbiter satellite microwave observations exclusively, and whose features are…
Experts contributing reviews
- None
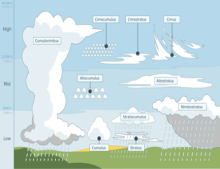 Cloud Dataset Overview
Years of record
- to
Clouds cover about 70% of the earth's surface. They are important components of the cliimate's water and energy budgets. Historically, cloud reports have come from station or ship observations. The satellite observation era, beginning in the 1980’s and spanning now…
-
Formats
-
Timestep
- Climatology, Monthly
-
Domain
- Global
-
Collections
- Overview / Comparison page
Experts contributing reviews
- Stubenrauch, Claudia
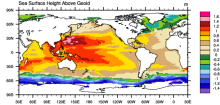 AVISO: Satellite derived Sea Surface Height above Geoid
Years of record
- to
The sea surface height relative to the geoid (the mean ocean surface of the Earth if the ocean is at rest) is derived from TOPEX/Poseidon, Envisat, Jason-1, and OSTM/Jason-2 altimetry measurements. Altimetry is a technique for measuring height. Satellite altimetry measures…
Experts contributing reviews
- None
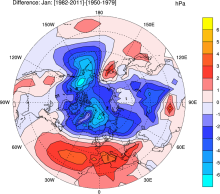 NCAR Sea Level Pressure
Years of record
- to
NCAR Sea Level Pressure is a gridded analysis of SLP based on land station reports, covering 1899 to present for latitudes 30°N-90°N. Quality controlled raw data plus empirical corrections for changes in instrumentation and station location.
-
Timestep
-
Domain
- NH - Northern Hemisphere
-
Collections
- Climate Analysis Section (CAS) Data Catalog
Experts contributing reviews
- Hurrell, James | Trenberth, Kevin
 NCEP-NCAR (R1): An Overview
Years of record
- to
NCEP-NCAR (R1) is the original reanalysis effort. It uses a frozen global state-of-the-art global data assimilation system (as of 11 January 1995). The original database was enhanced (additional, quality checked datasets) by NCAR's Data Support Section. Originally planned…
-
Timestep
- Sub-daily, Daily, Monthly
-
Domain
- Global
Experts contributing reviews
- None
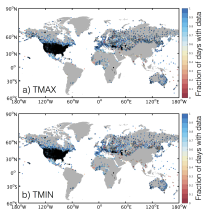 GHCN-D: Global Historical climatology Network daily temperatures
Years of record
- to
The Global Historical Climatology Network Daily database, GHCN-D, contains meteorological measurements from over 90,000 stations across the globe. The majority of station records contain precipitation data only, however other key variables including maximum…
Main variables and Earth System components
Atmosphere Maximum Air Temperature Minimum Air Temperature PrecipitationExperts contributing reviews
- McKinnon, Karen
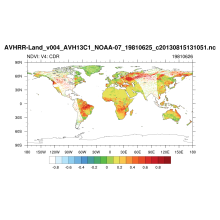 NDVI: Normalized-difference-vegetation-index: NOAA AVHRR
Years of record
- to
Normalized Difference Vegetation Index (NDVI) values are derived from surface reflectance data acquired by the Advanced Very High Resolution Radiometer (AVHRR) sensor. By applying knowledge gathered over time about instrument performance and sensor characteristics, the…
Experts contributing reviews
- None
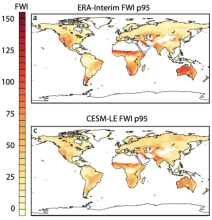 Canadian Forest Fire Weather Index (FWI)
Years of record
Fire weather indices are used to quantify the meteorological conditions that can lead to fire ignition and spread. They are used to communicate fire danger levels to emergency and fire fighting management, as well as the public on short time scales, and also for…
Main variables and Earth System components
Atmosphere-
Formats
-
Timestep
-
Domain
-
Collections
- None
Experts contributing reviews
- Touma, Danielle
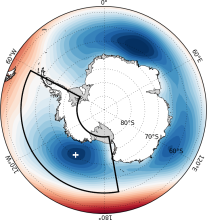 Amundsen Sea Low indices
Years of record
- to
The Amundsen Sea Low (ASL) is a climatological low pressure center located over the extreme southern Pacific Ocean, off the coast of West Antarctica. Atmospheric variability in this region is larger than anywhere else in the Southern Hemisphere, and exhibits…
-
Timestep
- Monthly, Seasonal, Annual
-
Collections
- None
Experts contributing reviews
- Hosking, Scott
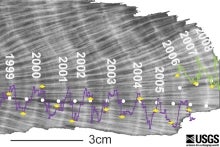
 Tree-ring width chronologies: An overview of their use as climate proxies and of available databases
Years of record
The width of an annual tree ring is a very simple indicator of the character of that year’s weather, but collectively the global network of tree-ring width measurements represents an invaluable resource for high-resolution paleoclimatology.
Main variables and Earth System components
-
Formats
-
Timestep
- Annual
-
Domain
- Global
-
Collections
- None
Experts contributing reviews
- St. George, Scott
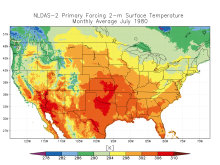 NLDAS: North American Land Data Assimilation System
Years of record
- to
The North American Land Data Assimilation System (NLDAS) integrates a large quantity of observation-based and model reanalysis data to produce long-term hourly atmospheric forcing data, and then uses this meteorological data to drive offline (not coupled to the atmosphere…
Main variables and Earth System components
Atmosphere Air Temperature CAPE Evaporation Precipitation Radiation Specific Humidity Surface Pressure Wind-
Timestep
- Climatology, Sub-daily, Monthly
-
Domain
- North America
-
Collections
- None
Experts contributing reviews
- Xia, Youlong | Mocko, David
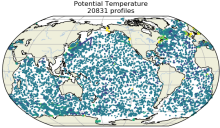 EN4 subsurface temperature and salinity for the global oceans
Years of record
- to
EN4 is a subsurface temperature and salinity dataset for the global oceans, spanning 1900 to present at a monthly timestep. It includes two types of data products: (1) a database of quality-controled in situ profiles and (2) a spatially complete analyses at 1 by 1 degree…
Main variables and Earth System components
Ocean potential temperature Sub Surface Salinity Sub Surface Temperature Sub-surface dataExperts contributing reviews
- Killick, Rachel
 AIRS (Atmospheric InfraRed Sounder): Version 6 Level 2
Years of record
- to
AIRS Version 6 Level 2 data represent a significant improvement over AIRS Version 5 Level 2 products in terms of greater stability, yield, and quality. Several algorithmic improvements have been made by the AIRS Project in conjunction with the AIRS Science Team.…
Main variables and Earth System components
Atmosphere Aerosols Air Temperature CO Geopotential Height Ozone: Tropospheric Precipitable water Specific HumidityExperts contributing reviews
- None
 World Ocean Atlas 2013 (WOA13)
Years of record
- to
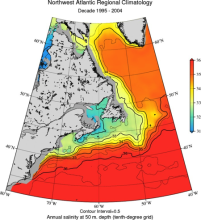
The World Ocean Atlas (WOA) is a set of climatological mean, gridded fields of oceanographic variables based on in-situ measurements from a wide variety of sources. Global, decadal averages of temperature, salinity, oxygen and nutrients are provided at monthly,…
Main variables and Earth System components
Ocean Dissolved Oxygen phosphate potential temperature silicate SST - sea surface temperature Sub Surface Salinity Sub Surface Temperature Sub-surface data-
Timestep
- Climatology, Monthly, Seasonal
-
Domain
- Global
-
Collections
- Diagnostic Data Sets, NCAR-DOE-CESM, oceandiagnostics
Experts contributing reviews
- Mishonov, Alexey
 QuikSCAT: near sea-surface wind speed and direction
Years of record
- to
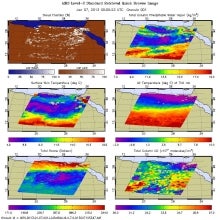
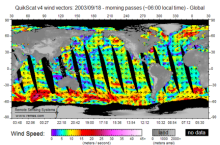
The QuikSCAT mission was intended to obtain sea-surface wind speed and direction data under all weather and cloud conditions over Earth's oceans. SeaWinds, an active radar scatterometer, is the main instrument on the QuikSCAT satellite. The microwave backscatter measured…
Experts contributing reviews
- Ricciardulli, Lucrezia
 Sea Ice Concentration data: Overview, Comparison table and graphs
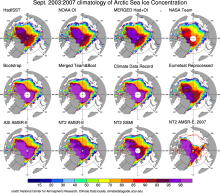
Years of record
Sea ice concentration is both an indicator and driver of changes high-latitude climate with strong societal and ecological importance. It is a key boundary condition for atmospheric models (including those used in atmospheric reanalyses) and a benchmark for coupled climate…
-
Formats
-
Timestep
-
Collections
- Overview / Comparison page
Experts contributing reviews
- None
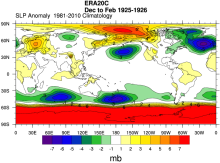 ERA-20C: ECMWF's atmospheric reanalysis of the 20th century (and comparisons with NOAA's 20CR)
Years of record
- to
The ECMWF's first atmospheric reanalysis of the 20th Century, ERA-20C, provides a long, gridded dataset of many climate variables, spanning 1900-2010. Observations assimilated include surface pressures from the International Surface Pressure Databank v3.2.6 and…
-
Timestep
- Sub-daily, Daily, Monthly
-
Domain
- Global
Experts contributing reviews
- Poli, Paul
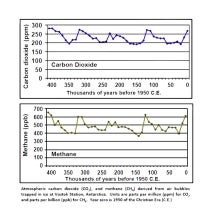 Overview: Carbon Dioxide (CO2) Data Sets
Years of record
- to
Directly measured and continuous records of atmospheric carbon dioxide (CO2) extend back to 1958. CO2 has also been measured in ancient air samples trapped in ice cores, and these records extend back hundreds of thousands of years. More recently, CO2 is being sampled by…
-
Formats
- ascii
-
Timestep
- Daily, Monthly, Annual
-
Domain
-
Collections
- Boundary Conditions, Carbon cycle, Overview / Comparison page
Experts contributing reviews
- None
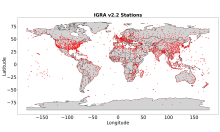 Integrated Global Radiosonde Archive (IGRA)
Years of record
- to
The largest publicly available collection of quality-controlled, globally-distributed, historical radiosonde and pilot balloon observations is the Integrated Global Radiosonde Archive (IGRA; Durre et al. 2006, 2018). First released in 2004, IGRA is maintained and…
Main variables and Earth System components
Atmosphere Dew Point Temperature Geopotential Height Multiple variables Relative Humidity WindExperts contributing reviews
- Durre, Imke | Korzeniewski, Bryant
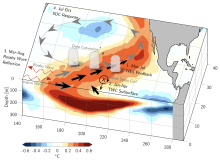
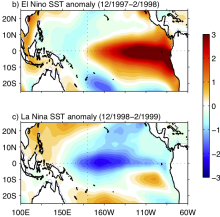 Asymmetry and Diversity in the pattern, amplitude and duration of El Niño and La Niña
Years of record
El Niño and La Niña, the two phases of ENSO, are sometimes described as opposites. However, there are asymmetries in their spatial structure, amplitude, duration and seasonal evolution. This leads to differing teleconnections and global impacts, as well as implications for…
-
Formats
-
Timestep
-
Domain
- Tropics
-
Collections
- None
Experts contributing reviews
- Santoso, Agus
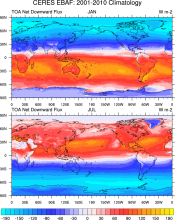 CERES EBAF: Clouds and Earth's Radiant Energy Systems (CERES) Energy Balanced and Filled (EBAF)
Years of record
- to
The CERES-EBAF product provides 1-degree regional, zonal and global monthly mean Top-of-Atmosphere (TOA) and surface (SFC) longwave (LW), shortwave (SW), and net (NET) fluxes under clear and all-sky conditions. EBAF is used for climate model evaluation, estimating the…
Experts contributing reviews
- Loeb, Norman
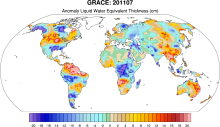 GRACE: Gravity Recovery and Climate Experiment: Surface mass, total water storage, and derived variables
Years of record
- to
The Gravity Recovery and Climate Experiment (GRACE) refers to a pair of NASA satellites that has flown in low-Earth orbit since 2002. The satellites use a precise microwave ranging system to measure the distance between themselves due to gravitational acceleration. Onboard…
Main variables and Earth System components
Cryosphere Glaciers Ice Sheet Mass Land Groundwater surface water Water Storage Ocean Bottom pressure-
Timestep
- Daily, Monthly
-
Domain
- Global
-
Collections
- Diagnostic Data Sets, NCAR-DOE-CESM, landdiagnostics, landicediagnostics
Experts contributing reviews
- Swenson, Sean
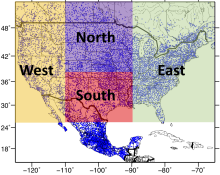 Livneh gridded precipitation and other meteorological variables for continental US, Mexico and southern Canada
Years of record
- to
The Livneh et al. (2015) hydrometeorological dataset consists of gridded daily and monthly precipitation, maximum and minimum air temperature, and wind speed for the continental US, southern Canada, and Mexico for the period 1950-2013. Gridded at 1/16° horizontal…
Main variables and Earth System components
Atmosphere Maximum Air Temperature Minimum Air Temperature Precipitation Wind-
Formats
- netCDF
-
Timestep
- Daily, Monthly
-
Domain
- North America
-
Collections
- None
Experts contributing reviews
- Livneh, Ben
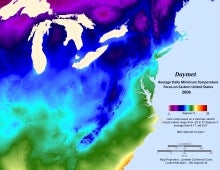 Daymet: Daily Surface Weather and Climatological Summaries
Years of record
- to
Daymet provides long-term, continuous, gridded estimates of daily weather and climatology variables by interpolating and extrapolating ground-based observations through statistical modeling techniques. The Daymet data products provide driver data for biogeochemical…
Main variables and Earth System components
Atmosphere Maximum Air Temperature Minimum Air Temperature Precipitation Radiation Water Vapor Cryosphere Snow Water Equivalent-
Timestep
- Climatology, Daily
-
Domain
- North America
-
Collections
- None
Experts contributing reviews
- Thornton, Peter E
 Meridional Modes and their indices
Years of record
In each of the world’s tropical ocean basins, year-to-year climate variability is primarily governed by fluctuations in the zonal sea surface temperature (SST) gradient and zonal surface winds. These variations consist of recognizable climate modes, such as the El Niño-…
-
Formats
-
Timestep
-
Domain
- Atlantic Ocean, Pacific Ocean
-
Collections
- None
Experts contributing reviews
- Amaya, Dillon
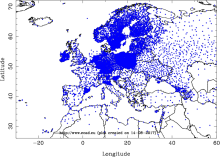 E-OBS: High-resolution gridded mean/max/min temperature, precipitation and sea level pressure for Europe & Northern Africa
Years of record
- to
E-OBS is a high spatial resolution daily gridded data that covers the European region and is based on the station data collated by the ECA&D initiative (Klein Tank et al., 2002). These data are supplied by many European National Meteorological Services and other data…
Main variables and Earth System components
Atmosphere Air Temperature Maximum Air Temperature Minimum Air Temperature Precipitation Sea Level PressureExperts contributing reviews
- van der Schrier, Gerard
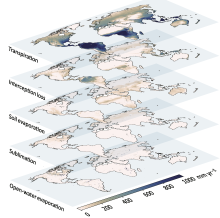 Global Land Evaporation Amsterdam Model (GLEAM)
Years of record
- to
The Global Land Evaporation Amsterdam Model (GLEAM) is a satellite remote sensing-based set of algorithms dedicated to the estimation of evaporation and soil moisture at global scales (Miralles et al. 2011). The current version of GLEAM (version 3) operates at a daily time…
Main variables and Earth System components
Biosphere land evaporation Land evapotranspiration Soil Moisture-
Formats
-
Timestep
- Daily
-
Domain
- Global
-
Collections
- None
Experts contributing reviews
- Miralles, Diego | Koppa, Akash
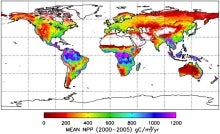 MODIS GPP/NPP Project (MOD17)
Years of record
- to
The goal of the MOD17 MODIS project is to provide continuous estimates of Gross/Net Primary Production (GPP/NPP) across Earth’s entire vegetated land surface. MOD17 GPP/NPP outputs are useful for natural resource and land management, global carbon cycle analysis, ecosystem…
Experts contributing reviews
- None
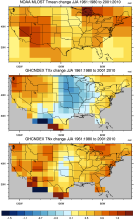 GHCNDEX: Gridded Temperature and Precipitation Climate Extremes Indices (CLIMDEX data)
Years of record
- to
GHCNDEX provides gridded, station-based indices of temperature- and precipitation- related climate extremes. It is intended for detection and attribution studies, climate model evaluation, and operational monitoring of extreme climatic events. Twenty-six indices, including…
Main variables and Earth System components
Atmosphere Maximum Air Temperature Minimum Air Temperature Land Freeze/ThawExperts contributing reviews
- None
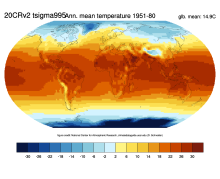 NOAA 20th-Century Reanalysis, Version 2 and 2c
Years of record
- to
The Twentieth Century Reanalysis (20CR) provides a comprehensive global atmospheric circulation data set spanning 1850-2014. Its chief motivation is to provide an observational validation data set, with quantified uncertainties, for assessing climate model simulations of…
-
Timestep
- Sub-daily, Daily, Monthly
-
Domain
- Global
Experts contributing reviews
- None
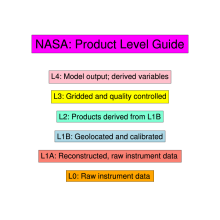 NASA Satellite Product Levels
Years of record
NASA data products are categorized into different "Levels". These are product dependent but the following description for OMI (Ozone Monitoring Instrument) data products is a general guideline:Level-1B (L1B): Products containing geolocated and calibrated spectral…
Main variables and Earth System components
-
Formats
-
Timestep
-
Domain
-
Collections
- None
Experts contributing reviews
- None
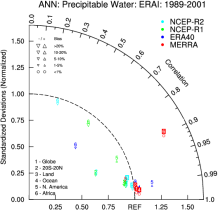
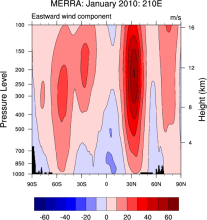 NASA MERRA
Years of record
- to
The Modern Era Retrospective-Analysis for Research and Applications (MERRA) was undertaken by NASA’s Global Modeling and Assimilation Office with two primary objectives: to place observations from NASA’s Earth Observing System satellites into a climate context and to…
Main variables and Earth System components
Atmosphere Air Temperature Geopotential Height Precipitable water Water Vapor-
Timestep
- Sub-daily, Monthly
-
Domain
- Global
Experts contributing reviews
- None
 Coral geochemical records: An overview of their use as climate proxies and of available databases
Years of record
Coral records are one of the main types of high-resolution (annual to sub-annual) paleoclimate proxies, providing timeseries of environmental conditions reaching hundreds to thousands of years into the past in the tropics, the central driver of the global atmospheric…
Main variables and Earth System components
Atmosphere Evaporation Evaporation-Precipitation Precipitation Ocean Salinity SST - sea surface temperature-
Formats
- ascii | HTML Table | Linked Paleo Data (LiPD) | Matlab
-
Timestep
-
Domain
- Atlantic Ocean, Indian Ocean, Pacific Ocean, Tropics
-
Collections
- None
Experts contributing reviews
- Lawman, Allison
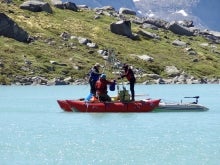 An overview of paleoclimate information from high-resolution lake sediment records: Strengths, limitations and key databases
Years of record
Accumulated sediments at the bottom of lakes are invaluable archives of past climate and environmental change. These sediments contain a variety of physical, geochemical, and biological proxy indicators that can be used to gain a multi-faceted understanding of past…
Main variables and Earth System components
Atmosphere Air Temperature Precipitation Biosphere Pollen Land-
Formats
- ascii | csv | Linked Paleo Data (LiPD)
-
Timestep
- Annual, Decadal, Irregular
-
Domain
- Global
-
Collections
- None
Experts contributing reviews
- Larocca, Laura | Broadman, Ellie
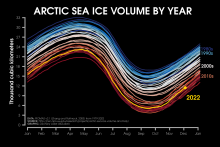 Pan-Arctic Ice Ocean Modeling and Assimilation System (PIOMAS)
Years of record
- to
The Pan-Arctic Ice-Ocean Modeling and Assimilation System (PIOMAS) is a reanalysis data set that uses a coupled ice and ocean model to provide daily and monthly estimates of Arctic sea-ice thickness. The data is publicly available from January 1979 to in near-real time.…
Experts contributing reviews
- Labe, Zachary
 Argo Ocean Temperature and Salinity Profiles
Years of record
- to
Argo is an array of over 3600 profiling floats distributed almost uniformly across the global oceans. First deployed in 2000, Argo floats provide temperature and salinity profiles from the surface to a depth of 2000m. The array has approximately 1 float for every…
Main variables and Earth System components
Ocean Salinity Sub Surface Salinity Sub Surface TemperatureExperts contributing reviews
- Willis, Josh
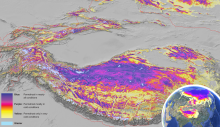 Global Permafrost Zonation Index Map
Years of record
This data set contains a global (excluding Antarctica) 1 km map of permafrost zonation. It is an estimate of to what degree permafrost exists in a region nearly everywhere, or only in the most favorable conditions. These local conditions affecting permafrost occurrence…
Experts contributing reviews
- Gruber, Stephan
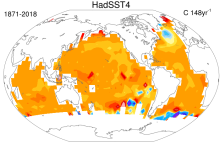 SST data: HadSST4
Years of record
- to
HadSST4 provides monthly SST anomalies on a 5°x5° grid for 1850-present. The anomalies are derived from a 30-year climatology spanning 1961-90. Coverage is global but there is no interpolation; Thus, missing data occur in the final product. This means that uncertainties…
-
Formats
- netCDF
-
Timestep
- Monthly
-
Domain
- Global
-
Collections
- Diagnostic Data Sets
Experts contributing reviews
- Kennedy, John
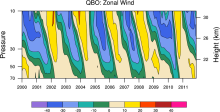 QBO: Quasi-Biennial Oscillation
Years of record
- to
The quasi-biennial oscillation (QBO) is a quasi-periodic oscillation of the equatorial zonal wind between easterlies and westerlies in the tropical stratosphere with a mean period of 28 to 29 months. The alternating wind regimes develop at the top of the lower stratosphere…
Experts contributing reviews
- None
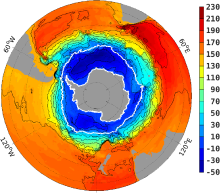 Southern Ocean State Estimate (SOSE)
Years of record
- to
The Southern Ocean State Estimate (SOSE) is a model-generated best fit to Southern Ocean observations. As such, it provides a quantitatively useful climatology of the mean-state of the Southern Ocean. Technically, SOSE is a solution to the MITgcm. SOSE is…
Main variables and Earth System components
Ocean 3D Velocity Bottom pressure SST - sea surface temperature Salinity Sub Surface Temperature mixed layer depth sea surface height u, v current components Wind Stress-
Formats
- binary
-
Timestep
- Daily, Monthly, Weekly, Annual
-
Collections
- None
Experts contributing reviews
- Mazloff, Matthew
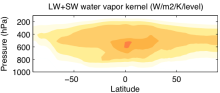 Radiative kernels from climate models
Years of record
The radiative kernel technique is a method used to quantify radiative feedbacks in response to global warming. Radiative kernels are commonly calculated for the water vapor, lapse rate, temperature and albedo feedbacks. Radiative kernels are used to deconstruct…
Main variables and Earth System components
Experts contributing reviews
- Pendergrass, Angeline