Climate Data
The Climate Data Guide is a high-traffic expert knowledge portal providing concise and reliable information on the data that are essential for monitoring and understanding the Earth System. Currently, it curates expert insights on over 200 observational datasets and indices, searchable or browseable in the list below.
To find a specific dataset or climate variable, jump to the the search box. For only the datasets paired with guidance written by experts, select the "Datasets with guidance" button when using the search box.
Data creators, data publishers, and scientists who use climate data are invited to join our Network of Experts by contributing commentaries on data strengths and limitations to the Climate Data Guide. What type of data are included? See this discussion.
With the exception of about 25 climate indices, the Climate Data Guide does not host datasets. Data cannot be downloaded from this site. However, links are provided to download locations under the "Data Access" section of each dataset page.
Citation: Please link to this website in your work that draws upon material from this website, and cite this paper:
Schneider, D. P., C. Deser, J. Fasullo, and K. E. Trenberth, 2013: Climate Data Guide Spurs Discovery and Understanding. Eos Trans. AGU, 94, 121–122, https://doi.org/10.1002/2013eo130001.
=> Additionally, each dataset page with expert-written guidance has its own citation example on the individual page, such that the experts who wrote the guidance may be credited. Finally, responsible use and citation of datasets is strongly encouraged.
Climate datasets
 NSIDC Sea Ice Index
Years of Record
- 1978-10 to 2022-01
The NSIDC Sea Ice Index is a suite of easy-to-use sea ice analyses to track changes in Arctic and Antarctic sea ice. The product is produced and supported by the NOAA at NSIDC group and consists of browse imagery and data text files (CSV or Excel format). The input data…
Experts contributing reviews
- Meier, Walter
 Tropical Moored Buoy System: TAO, TRITON, PIRATA, RAMA (TOGA)
Years of Record
- 1992-01 to 2013-04
The Tropical Ocean Global Atmosphere program (TOGA) is a component of the World Climate Research Programme (WCRP) aimed specifically at the prediction of climate phenomena on time scales of months to years. In order to achieve the TOGA goals, a strategy of large-scale,…
Main variables and Earth System components
Atmosphere Air Temperature Precipitation Radiation Relative Humidity Sea Level Pressure Wind Ocean Absolute Dynamic Topography (ADT) Ocean Heat Content SST - sea surface temperature Salinity Sub Surface Salinity Sub Surface Temperature u, v current componentsExperts contributing reviews
- None
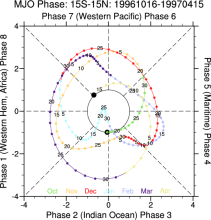 MJO: Madden-Julian Oscillation Diagnostics
Years of Record
"The Madden–Julian oscillation (MJO) is the largest element of the intraseasonal (30–90 days) variability in the tropical atmosphere. It is a large-scale coupling between atmospheric circulation and tropical deep convection.[1][2] Rather than being a standing pattern (like…
Main variables and Earth System components
-
Formats
-
Timestep
-
Domain
-
Collections
- None
Experts contributing reviews
- None
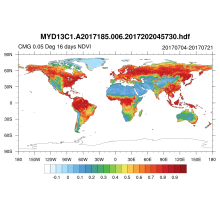 NDVI and EVI: Vegetation Indices (MODIS)
Years of Record
- 2002-02 to 2018-03
MODIS vegetation indices, produced on 16-day and monthly intervals and at multiple spatial resolutions, provide consistent spatial and temporal comparisons of vegetation canopy greenness, a composite property of leaf area, chlorophyll and canopy structure. Two vegetation…
Main variables and Earth System components
Land Enhanced Vegetation Index (EVI) NDVI" Normalized Difference Vegetation IndexExperts contributing reviews
- None
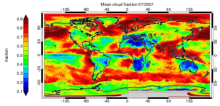
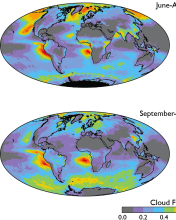 Cloud observations from MODIS
Years of Record
- 2000-03 to 2018-05
The Moderate Resolution Imaging Spectroradiometer (MODIS) is scanning instrument that makes measurements in 36 spectral bands from the visible to the thermal infrared at spatial resolutions from 250 m to 1 km. There are MODIS instruments aboard two sun-synchronous polar-…
-
Timestep
- Daily, Monthly, Weekly
-
Domain
- Global
-
Collections
- Diagnostic Data Sets, NCAR-DOE-CESM, atmosdiagnostics, Obs4MIPS
Experts contributing reviews
- Pincus, Robert
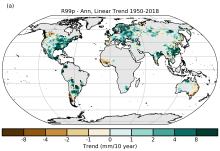 HadEX3: Gridded Temperature and Precipitation Climate Extremes Indices (CLIMDEX data)
Years of Record
- 1901-01 to 2018-12
HadEX3 provides gridded, station-based indices of temperature- and precipitation- related climate extremes and supersedes HadEX2. It is intended for global and continental climate monitoring, detection and attribution studies and climate model evaluation. Twenty-nine…
Main variables and Earth System components
Atmosphere Air Temperature at 2m Maximum Air Temperature Minimum Air Temperature Land Freeze/ThawExperts contributing reviews
- Dunn, Robert
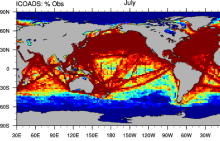 ICOADS Surface Marine Weather Observations
Years of Record
ICOADS (International Comprehensive Ocean-Atmosphere Data Set) is the most comprehensive archive of global marine surface climate observations available. Variables include SST, SLP, air temperature, wind speed, cloud amount, and others. There is no processing beyond…
Main variables and Earth System components
Atmosphere Air Temperature Budget Cloud Properties Latent & sensible heat flux Sea Level Pressure Specific Humidity Wind Ocean SST - sea surface temperatureExperts contributing reviews
- Deser, Clara
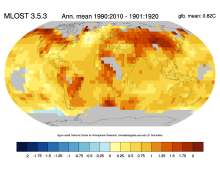 Global surface temperature data: MLOST: NOAA Merged Land-Ocean Surface Temperature Analysis
Years of Record
- 1871-01 to 2021-09
NOAA's Merged Land-Ocean Surface Temperature Analysis (MLOST) combines land surface air temperatures primarily from the Global Historical Climatology Network, Monthly (GHCN-M) version 3 with SSTs of the ERSSTv3b analysis into a comprehensive global surface temperature…
Main variables and Earth System components
Atmosphere Air Temperature Ocean SST - sea surface temperature-
Timestep
- Monthly
-
Domain
- Global
Experts contributing reviews
- None
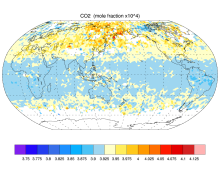 AIRS and AMSU: Trace Gases (CO2, CO, CH4, O3...); Level 3
Years of Record
AIRS provides satellite retrieval of mid-tropospheric carbon dioxide even under cloudy conditions, without the use of a priori information from models. AIRS retrievals use cloud-cleared thermal IR radiance spectra in the 15 micron band with an accuracy better than 2 ppm.…
Main variables and Earth System components
Atmosphere CO Ozone: Tropospheric Biosphere CH4-Methane CO CO2-
Timestep
- Sub-daily, Daily, Monthly
-
Domain
- Global
-
Collections
- Carbon cycle
Experts contributing reviews
- None
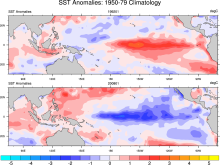
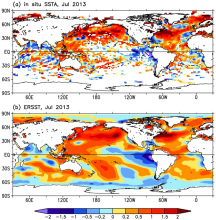 SST data: NOAA Extended Reconstruction SSTs, version 3 (ERSSTv3 & 3b)
Years of Record
- 1854-01 to 2020-02
Note: ERSST is currently on version 6. See the ERSSTv6 page here. The NOAA Extended Reconstruction Sea Surface Temperature (ERSST) provides global, spatially complete SST data at a monthly timestep for 1854-present. Version3 is based upon statistical interpolation…
-
Timestep
- Monthly
-
Domain
- Global
Experts contributing reviews
- Huang, Boyin | Livermore, Jay | Smith, Tom
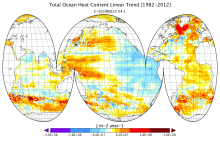 CMCC Global Ocean Reanalysis System (C-GLORS)
Years of Record
- 1982-01 to 2013-12
"The CMCC Global Ocean Physical Reanalysis System (C-GLORS) is used to simulate the state of the ocean in the last decades. It consists of a variational data assimilation system (OceanVar), capable of assimilating all in-situ observations along with altimetry data,…
Main variables and Earth System components
Ocean Ocean Heat Content SST - sea surface temperature Salinity Sub Surface Salinity Sub Surface Temperature mixed layer depth sea surface height u, v current componentsExperts contributing reviews
- Storto, Andrea
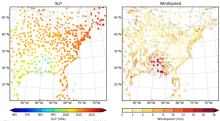 HadISD: Sub-daily, non-interpolated weather station data
Years of Record
- 1931-01 to 2023-03
HadISD ("Hadley Centre Integrated Surface Database") is a compendium of subdaily weather-station data developed by the UK Met Office that is based on NOAA NCEI's Integrated Surface Database but with various quality-control checks implemented to remove stations with…
Main variables and Earth System components
Atmosphere Air Temperature at 2m Dew Point Temperature Precipitation Sea Level Pressure Storm data WindExperts contributing reviews
- Raymond, Colin
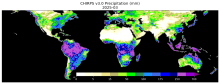 CHIRPS: Climate Hazards InfraRed Precipitation with Station data (Version 3)
Years of Record
- 1981-01 to 2025-06
Climate Hazards Group InfraRed Precipitation with Station data version 3 (CHIRPS v3)is a 1981-present, land-only, high resolution 0.05° gridded precipitation dataset. It combines thermal-infrared geostationary satellite-based estimates (CHIRP3), in situ observations from…
Main variables and Earth System components
Precipitation-
Formats
- GeoTIFF
-
Timestep
- Climatology, Monthly, Annual, Pentad
-
Domain
- Africa, Global, South America
-
Collections
- None
Experts contributing reviews
- Alaso, Daniella
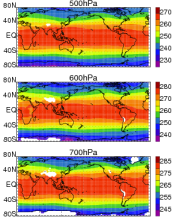 AIRS and AMSU: Tropospheric air temperature and specific humidity
Years of Record
- 2002-09 to 2011-05
The Atmospheric Infrared Sounder (AIRS) project has generated decadal-length, global, gridded data sets of temperature and specific humidity for several standard levels in the troposphere for the obs4MIPS project. This obs4MIPS version of the AIRS data are available at…
Experts contributing reviews
- Tian, Baijun
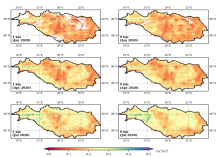
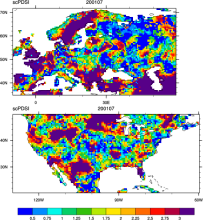 CRU sc-PDSI (self-calibrating PDSI) over Europe & North America
Years of Record
- 1901-01 to 2002-12
Maps of the monthly self-calibrating Palmer drought severity index (SCPDSI) have been calculated for the period 1901–2002 for the contiguous United States (20°–50°N and 130°–60°W) and Europe (35°–70°N, 10°W–60°E) with a spatial resolution of 0.5° × 0.5°
-
Formats
- ascii
-
Timestep
- Monthly
-
Domain
- Europe, North America
-
Collections
- None
Experts contributing reviews
- None
 Merged Hadley-NOAA/OI Sea Surface Temperature & Sea-Ice Concentration (Hurrell et al, 2008)
Years of Record
- 1870-01 to 2020-08
The merged Hadley-OI sea surface temperature (SST) and sea ice concentration (SIC) data sets were specifically developed as surface forcing data sets for AMIP style uncoupled simulations of the Community Atmosphere Model (CAM). The Hadley Centre's SST/SIC version 1.1 (…
Main variables and Earth System components
Cryosphere Sea Ice Concentration Ocean SST - sea surface temperature-
Formats
- netCDF
-
Timestep
- Monthly
Experts contributing reviews
- None
 ORAS4: ECMWF Ocean Reanalysis and derived ocean heat content
Years of Record
- 1958-01 to 2013-04
ECMWF's current ocean reanalysis uses a sophisticated data assimilation methodology which includes a model bias correction. The ocean model used is forced by atmospheric daily surface fluxes, relaxed to SST and bias corrected. The Balmaseda et al (QJRMS 2013) reference…
Main variables and Earth System components
Ocean Ocean Heat Content Salinity Sea Level potential temperature u, v current components-
Timestep
- Monthly
-
Domain
- Global
-
Collections
- Climate Analysis Section (CAS) Data Catalog
Experts contributing reviews
- None
 SST data: COBE: Centennial in situ Observation-Based Estimates
Years of Record
- 1891-01 to 2020-03
The COBE data set is a spatially complete, interpolated 1°x1° SST product for 1891 to present. It combines SSTs from ICOADS release 2.0, the Japanese Kobe collection, and reports from ships and buoys. Data are gridded using optimal interpolation. As in HadISST, data up to…
Experts contributing reviews
- None
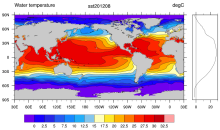
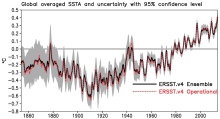 SST data: NOAA Extended Reconstruction SSTs, Version 4
Years of Record
- 1981-10 to 2022-02
Note: ERSST is currently on version 6. See the ERSSTv6 page here. The NOAA Extended Reconstruction Sea Surface Temperature (ERSST) provides global, spatially complete SST data at a monthly timestep for 1854-present. Compared to the previous version, Version 4…
Experts contributing reviews
- Huang, Boyin
 Combined CloudSat spaceborne radar and CALIPSO spaceborne lidar cloud fraction dataset (3S-GEOPROF-COMB)
Years of Record
- 2006-07 to 2019-07
A global (82S-82N) cloud fraction data set, providing a unique view of cloud vertical structure, has been developed based on the complimentary spaceborne remote sensing capabilities of the CloudSat radar and the CALISPSO lidar. The data set provides monthly mean cloud…
-
Formats
- netCDF
-
Timestep
- Monthly, Seasonal, Annual
-
Domain
- Global
-
Collections
- Diagnostic Data Sets, NCAR-DOE-CESM, atmosdiagnostics
Experts contributing reviews
- Bertrand, Leah | Kay, Jennifer
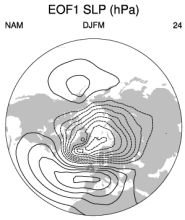 Hurrell wintertime SLP-based Northern Annular Mode (NAM) Index
Years of Record
- 1899-01 to 2025-03
The NAM (or Arctic Oscillation) is defined as the first EOF of NH (20°-90°N) winter SLP data. It explains 23% of the extended winter mean (December-March) variance, and it is clearly dominated by the NAO structure in the Atlantic sector. Although there are some subtle…
-
Formats
- ascii
-
Timestep
- Seasonal
-
Collections
- None
Experts contributing reviews
- Phillips, Adam
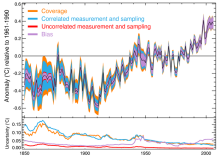 SST data: HadSST3
Years of Record
- 1850-01 to 2017-12
HadSST3 provides monthly SST anomalies on a 5°x5° grid for 1850-present. The anomalies are derived from a 30-year climatology spanning 1961-90.Coverage is global but there is no interpolation; Thus, missing data occur in the final product. The primary input data are from…
-
Timestep
- Monthly
-
Domain
- Global
Experts contributing reviews
- Kennedy, John
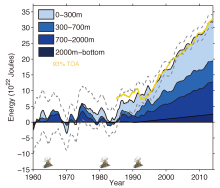 Ocean temperature analysis and heat content estimate from Institute of Atmospheric Physics
Years of Record
- 1940-01 to 2016-12
The Institute of Atmospheric Physics (IAP) ocean temperature analysis features global coverage of the oceans, at 1° x1° horizontal resolution on 41 vertical levels from 1-2000m, and monthly resolution from 1940 to present. As such, it is aimed at studies of climate…
Main variables and Earth System components
Ocean Ocean Heat Content Sea Level Sub Surface TemperatureExperts contributing reviews
- Cheng, Lijing
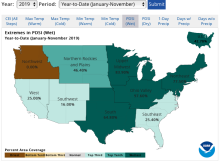 U.S. Climate Extremes Index (CEI)
Years of Record
- 1910-01 to 2019-11
The U.S. Climate Extremes Index (CEI) was first presented in 1995 as a framework for quantifying observed changes in climate within the contiguous United States. At present, the CEI evaluates the percent area of extremes in the distribution of much above/below…
Main variables and Earth System components
Atmosphere Air Temperature Maximum Air Temperature Minimum Air Temperature Precipitation Wind Land Drought-
Formats
- ascii
-
Timestep
- Monthly, Seasonal, Annual
-
Domain
- North America
-
Collections
- None
Experts contributing reviews
- Gleason, Karin
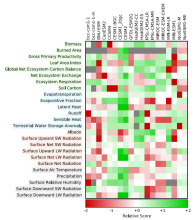 Making sense of data from Land Surface Models (LSMs)
Years of Record
The land surface is a dynamic and complex component of the Earth system, shaping climate and biogeochemical cycles and serving as the origin of many anthropogenic impacts on the planet. Comprising complex and interactive organic and inorganic systems (soils, rocks, water…
-
Formats
-
Timestep
-
Domain
-
Collections
- None
Experts contributing reviews
- Mankin, Justin | Lesk, Corey
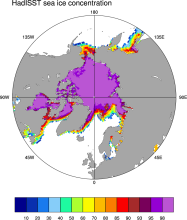 Sea Ice Concentration data from HadISST
Years of Record
- 1870-01 to 2021-12
Spanning 1871-present at monthly timesteps, HadISST provides the longest gridded sea ice data available for both the Arctic and Antarctic. It is a 1° x 1° spatially infilled data set that is It is intended as a consistent analyses for input into SST analyses or as boundary…
-
Timestep
- Monthly
-
Collections
- Boundary Conditions
Experts contributing reviews
- None
 SMAP-Derived 1-km Downscaled Surface Soil Moisture
Years of Record
- 2015-04 to 2022-09
This data product contains global daily 1 km resolution surface soil moisture (SM) derived from the Soil Moisture Active Passive (SMAP) L-band radiometer observations. Specifically, Moderate Resolution Imaging Spectroradiometer (MODIS) land surface temperature and…
-
Formats
-
Timestep
- Daily
-
Domain
- Global
-
Collections
- None
Experts contributing reviews
- Lakshmi, Venkataraman | Fang, Bin
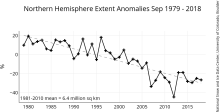
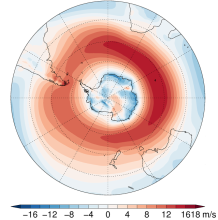 Southern Hemisphere westerly jet strength and position
Years of Record
- 1979-12 to 2016-12
The dynamics of the Southern Hemisphere westerly jet are described in terms of two indices, jet strength and jet latitude. Here, these indices are defined using the ERA-Interim reanalysis, although other datasets, including climate models, could be used. …
-
Formats
- ascii
-
Timestep
- Seasonal, Annual
-
Collections
- None
Experts contributing reviews
- Bracegirdle, Thomas J.
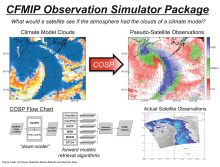 COSP: Cloud Feedback Model Intercomparison Project (CFMIP) Observation Simulator Package
Years of Record
Cloud processes and feedbacks are recognized as the largest uncertainty in climate model projections. Progress in understanding the roles of clouds in the response of the Earth to changes in external forcing (GHG, aerosoles, etc.) has in part been hampered by the lack of…
-
Formats
-
Timestep
-
Domain
- Global
-
Collections
- Diagnostic Data Sets, NCAR-DOE-CESM, atmosdiagnostics
Experts contributing reviews
- Kay, Jennifer
 Speleothems and the SISAL database: An overview of the use of speleothems as archives of climate proxies
Years of Record
Speleothems provide globally distributed, seasonal to multi-annual resolution climate records encoded in multiple proxies including oxygen and carbon stable isotopes, and trace elements. Speleothems, such as stalagmites and flowstones, are secondary cave carbonate…
Main variables and Earth System components
-
Formats
-
Timestep
- Annual, Decadal, Irregular
-
Domain
- Global
-
Collections
- None
Experts contributing reviews
- Kaushal, Nikita | Lechleitner, Franziska
 Drought atlases from tree rings
Years of Record
- 0000-01 to 2005-12
Tree-ring drought atlases provide a paleoclimate analog to modern drought indices, most commonly the Palmer Drought Severity Index (PDSI). Produced on a regular lat-lon grid for regions such as North America, Europe, and Australia, these centuries-long datasets are…
-
Timestep
- Annual
-
Domain
- North America
-
Collections
- None
Experts contributing reviews
- Cook, Edward
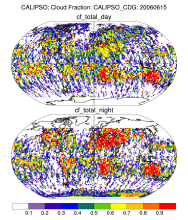 CALIPSO
Years of Record
- 2006-06 to 2017-01
CALIPSO (Cloud-Aerosol Lidar and Infrared Pathfinder Satellite Observations ) was launched on April 28, 2006 to study the impact of clouds and aerosols on the Earth's radiation budget and climate. It flies in formation with five other satellites in the international "A-…
Experts contributing reviews
- None
 CERA-20C: ECMWF's Coupled Ocean-Atmosphere Reanalysis of the 20th Century
Years of Record
- 1901-01 to 2010-12
The CERA-20C is a global, coupled reanalysis spanning 1901-2010 with a focus on low-frequency climate variability. Similar to ERA-20C, the surface observations assimilated include surface pressures from the International Surface Pressure Databank v3.2.6 and ICOADS v…
Main variables and Earth System components
Atmosphere Multiple variables Cryosphere Sea Ice Concentration OceanExperts contributing reviews
- Laloyaux, Patrick
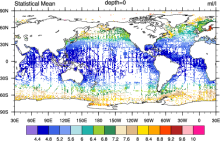 World Ocean Atlas (WOA09)
Years of Record
World Ocean Atlas 2009 (WOA09) is a set of objectively analyzed (1 degree grid) climatological fields of in situ temperature, salinity, dissolved oxygen, Apparent Oxygen Utilization (AOU), percent oxygen saturation, phosphate, silicate, and nitrate at standard depth levels…
Main variables and Earth System components
Ocean Dissolved Oxygen SST - sea surface temperature Salinity Sub Surface Salinity Sub Surface Temperature oxygen saturation phosphate silicate-
Timestep
- Climatology, Monthly, Seasonal, Annual
-
Domain
- Global
-
Collections
- Diagnostic Data Sets, NCAR-DOE-CESM, oceandiagnostics
Experts contributing reviews
- None
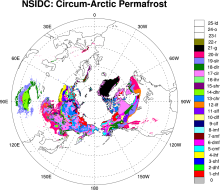 Permafrost: Circum-Arctic Map of Permafrost and Ground Ice Conditions
Years of Record
The circumpolar permafrost and ground ice data contribute to a unified international data set that depicts the distribution and properties of permafrost and ground ice in the Northern Hemisphere (20°N to 90°N). The re-gridded data set shows discontinuous, sporadic, or…
-
Timestep
- Climatology
-
Domain
- NH - Northern Hemisphere
-
Collections
- None
Experts contributing reviews
- None
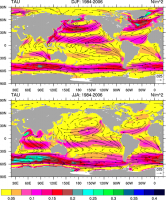 COREv2 Air-Sea Surface Fluxes
Years of Record
- 1949-01 to 2006-12
The Coordinated Ocean Research Experiments version 2 (COREv2) data set consists of a globally complete set of air-sea fluxes of momentum, heat and freshwater for 1948-2009 at monthly resolution. This data set serves as a set of common atmospheric boundary…
Main variables and Earth System components
Atmosphere Evaporation Precipitation Radiation Wind Stress Land Runoff and Streamflow Ocean Surface Flux-
Formats
- netCDF
-
Timestep
- Monthly
-
Domain
- Global
-
Collections
- Diagnostic Data Sets, NCAR-DOE-CESM, atmosdiagnostics, oceandiagnostics
Experts contributing reviews
- Yeager, Stephen
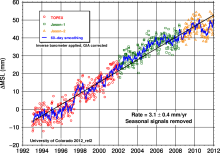 Global Mean Sea Level from TOPEX & Jason Altimetry
Years of Record
- 1992-10 to 2015-10
The global mean sea level timeseries is an excellent, integrative indicator of long-term global temperature trends, providing a record that is observed and processed independent of common metrics like global surface air temperature. The major contributions to the…
Experts contributing reviews
- Nerem, R.S.
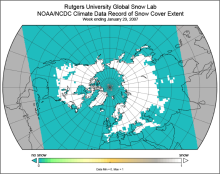 Snow Cover Extent (Northern Hemisphere) Climate Data Record, by Rutgers
Years of Record
- 1966-10 to 2021-09
The Snow Cover Extent Climate Data Record extends from the late 1960s to present. Historical analyses based on visual inspection have been digitized and combined with modern multi-spectral remote sensing to produce a seamless record on a hemispheric scale. The data are…
-
Timestep
- Monthly, Weekly
-
Domain
- North America
-
Collections
- Climate Data Record, Diagnostic Data Sets, NCAR-DOE-CESM, landdiagnostics
Experts contributing reviews
- Estilow, Thomas W. | Robinson, David
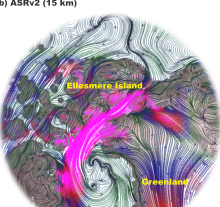 Arctic System Reanalysis (ASR)
Years of Record
- 2000-01 to 2012-12
The Arctic System Reanalysis is a multi-agency, university-led retrospective analysis (reanalysis) of the Greater Arctic. ASR is produced using high-resolution versions of the Polar Weather Forecast Model (PWRF) and the WRF-VAR and High Resolution Land Data Assimilation (…
Experts contributing reviews
- None
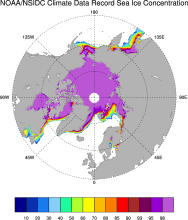 Sea Ice Concentration: NOAA/NSIDC Climate Data Record
Years of Record
- 1978-10 to 2023-12
The NOAA/NSIDC Climate Data Record (CDR) of sea ice concentration is available at 25 x 25 km spatial resolution in daily or monthly timesteps for 1987-2014. It provides a consistent interpretation of sea ice for the satellite record, with the intent of being suitable for…
-
Formats
- netCDF
-
Timestep
- Daily, Monthly
-
Collections
- Climate Data Record
Experts contributing reviews
- Meier, Walter
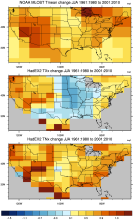 HadEX2: Gridded Temperature and Precipitation Climate Extremes Indices (CLIMDEX data)
Years of Record
- 1901-01 to 2010-12
Note: HadEX2 has been superseded by HadEX3. HadEX2 provides gridded, station-based indices of temperature- and precipitation- related climate extremes. It is intended for detection and attribution studies and climate model evaluation. Twenty-nine indices, including daily…
Main variables and Earth System components
Atmosphere Maximum Air Temperature Minimum Air Temperature Land Freeze/ThawExperts contributing reviews
- None
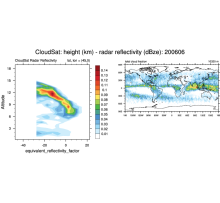 CloudSat
Years of Record
- 2006-06 to 2010-11
CloudSat is a satellite mission designed to measure the vertical structure of clouds from space. The radar data produces detailed images of cloud structures. CloudSat is one of a constellation of satellites known as the A-Train (Cloudsat, CALIPSO, PARASOL, Aqua, Aura,…
Experts contributing reviews
- None
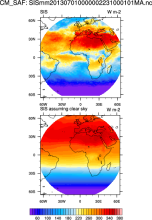
 CLARA-A1: Cloud properties, surface albedo and surface radiation products based on AVHRR
Years of Record
- 1982-01 to 2009-12
"CLARA-A1 (CLoud, Albedo and RAdiation dataset, AVHRR-based, version 1) is a global dataset of cloud properties, surface albedo and surface radiation products, generated by the EUMETSAT Satellite Application Facility on Climate Monitoring (CM SAF). The products are derived…
Main variables and Earth System components
Atmosphere Cloud Properties Liquid Water Path Radiation Surface albedo-
Formats
- netCDF
-
Timestep
- Daily, Monthly, Pentad
-
Domain
- Global
-
Collections
- Climate Data Record
Experts contributing reviews
- Stengel, Martin
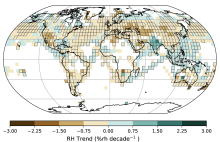 Global near-surface humidity data: HadISDH
Years of Record
- 1973-01 to 2023-12
HadISDH (Met Office Hadley Centre International Surface Dataset of Humidity) is a gridded 5°x5° monthly mean product beginning in January 1973, and updated annually. It provides monthly gridded specific humidity (q), relative humidity (RH), vapor pressure (e), dew point…
Main variables and Earth System components
Atmosphere Air Temperature at 2m Relative Humidity Specific HumidityExperts contributing reviews
- Willett, Kate
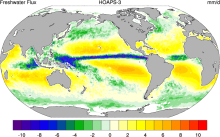 HOAPS: Hamburg Ocean Atmosphere Parameters and Fluxes from Satellite Data
Years of Record
- 1987-01 to 2008-12
The Hamburg Ocean Atmosphere Parameters and Fluxes from Satellite Data (HOAPS) set is a satellite-based climatology of precipitation, evaporation and freshwater budget (evaporation minus precipitation) as well as related turbulent heat fluxes and atmospheric state…
Main variables and Earth System components
Atmosphere Evaporation Evaporation-Precipitation Precipitation Radiation Specific Humidity Wind Latent & sensible heat flux Precipitable water Ocean SST - sea surface temperature-
Formats
- netCDF
-
Timestep
- Climatology, Sub-daily, Monthly, Pentad
-
Domain
- Global
-
Collections
- Boundary Conditions
Experts contributing reviews
- None
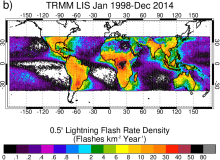 Lightning data from the TRMM and ISS Lightning Image Sounder (LIS): Towards a global lightning Climate Data Record
Years of Record
- 1998-01 to 2023-08
The Lightning Imaging Sensor (LIS) is an optically based spaceborne lightning detection instrument that has been hosted on two different platforms – the Tropical Rainfall Measuring Mission satellite (TRMM; 1998-2015; Kummerow et al. 1998) and the International Space…
Experts contributing reviews
- Lang, Timothy
 Surface Solar Radiation Data Set - Heliosat (SARAH) -Edition 1
Years of Record
- 1983-01 to 2013-12
"The Surface Solar Radiation Data Set - Heliosat (SARAH) is a satellite-based climatology of the solar surface irradiance (SIS), the surface direct normalized irradiance (DNI) and the effective cloud albedo (CAL) derived from satellite observations of the visible channels…
-
Formats
- netCDF
-
Timestep
- Sub-daily, Daily, Monthly
-
Collections
- Climate Data Record
Experts contributing reviews
- None
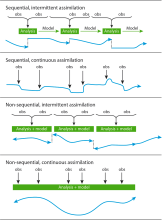 Simplistic Overview of Reanalysis Data Assimilation Methods
Years of Record
Data assimilation is the process of combining observations from a wide variety of sources and forecast output from a weather prediction model. The resulting analysis is considered to be the 'best' estimate of the state of the atmosphere at a particular instant in time. The…
Main variables and Earth System components
Atmosphere-
Formats
-
Timestep
-
Domain
-
Collections
- None
Experts contributing reviews
- None
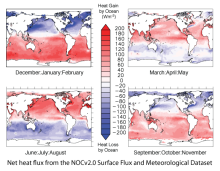 Surface Flux and Meteorological Dataset: National Oceanography Centre (NOC) V2.0
Years of Record
- 1973-01 to 2014-12
The National Oceanography Centre (NOC) Version 2.0 Surface Flux and Meteorological Dataset is a monthly mean gridded dataset of marine surface measurements and derived fluxes constructed using optimal interpolation. Input for the period 1973 to 2006 are ICOADS…
-
Formats
- netCDF
-
Timestep
- Monthly
-
Domain
- Global
-
Collections
- Climate Data Record
Experts contributing reviews
- Kent, Elizabeth
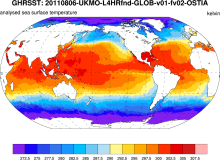 GHRSST: Group for High Resolution Sea Surface Temperature
Years of Record
- 2006-01 to 2012-12
The Group for High-Resolution Sea Surface Temperature (SST; GHRSST) provides a new generation of global high-resolution (10km) SST products to the operational oceanographic, meteorological, climate and general scientific community. The products are provided at a variety of…
Experts contributing reviews
- None